Game Preparation: Using Tracking Data To Prepare Your Match-up
The latest tool of SkillCorner’s online basketball tracking data platform
Getting To Know Your Opponent While On The Clock
Basketball seasons are the definition of a race against time. Games come and go like a fast break: by the time you’ve caught your breath, the next one is already coming down the floor.
Game preparation is no different: every extra insight can give you the edge in the coming confrontation.
Every hour spent charting is an hour not spent coaching. The question becomes: how do you optimize your time?
Introducing Our “Game Preparation” Tool
Elite programs have the video room and analytics staff to study opponents. Our WebApp brings these assets to all teams. We turn our tracking and event data into an actionable opponent report. Identify their tendencies, key players and how they compare to you. Build your report in a few clicks and get back to preparing the game on the court.
WebApp Game Preparation In 90 Seconds
Selecting your opponent and building a report in under two minutes
To illustrate our WebApp, we chose the Michigan Wolverines and UConn, finalists of the 25-26 National Championship.
In a few clicks, we pick both teams and season and get straight to work.
You immediately get an overview of your stats and your opponent’s to see how well both of you rank in comparison to the league in key aspects of the game. You are also able to go through each match-up to get a better understanding of how they play and how you compare.
From The App To The Locker Room
Once all this insight is gathered, it needs to reach the locker room. Whether through the hub, flat files delivered on enterprise-grade AWS infrastructure or our API, you can connect SkillCorner’s data to your internal systems and share it with ease to all decision-makers.
- Coaches get the visuals: charts, court maps…
- Assistant coaches get the details and insights in a few clicks.
- Players get an objective gameplan for their matchup
Everybody prepares with the same insights.
In Practice: The 2025-26 National Championship Final
The true power of the WebApp lies in its ability to put a team's tendencies next to its opponent’s on both ends of the court.
Analyzing How A Team Operates
Where do their shots come from? What are the drive matchups? How does a team defend pick-and-rolls? When preparing for a game, knowing how a team operates lets you adapt. The WebApp shows you how often a team does something, not just how well. After all, in a game like basketball, frequency is what a team relies on, game after game.
As mentioned before, we chose the Michigan Wolverines and UConn Huskies for our showcase. Let’s see how Michigan’s offense operates and how UConn’s defense is built.
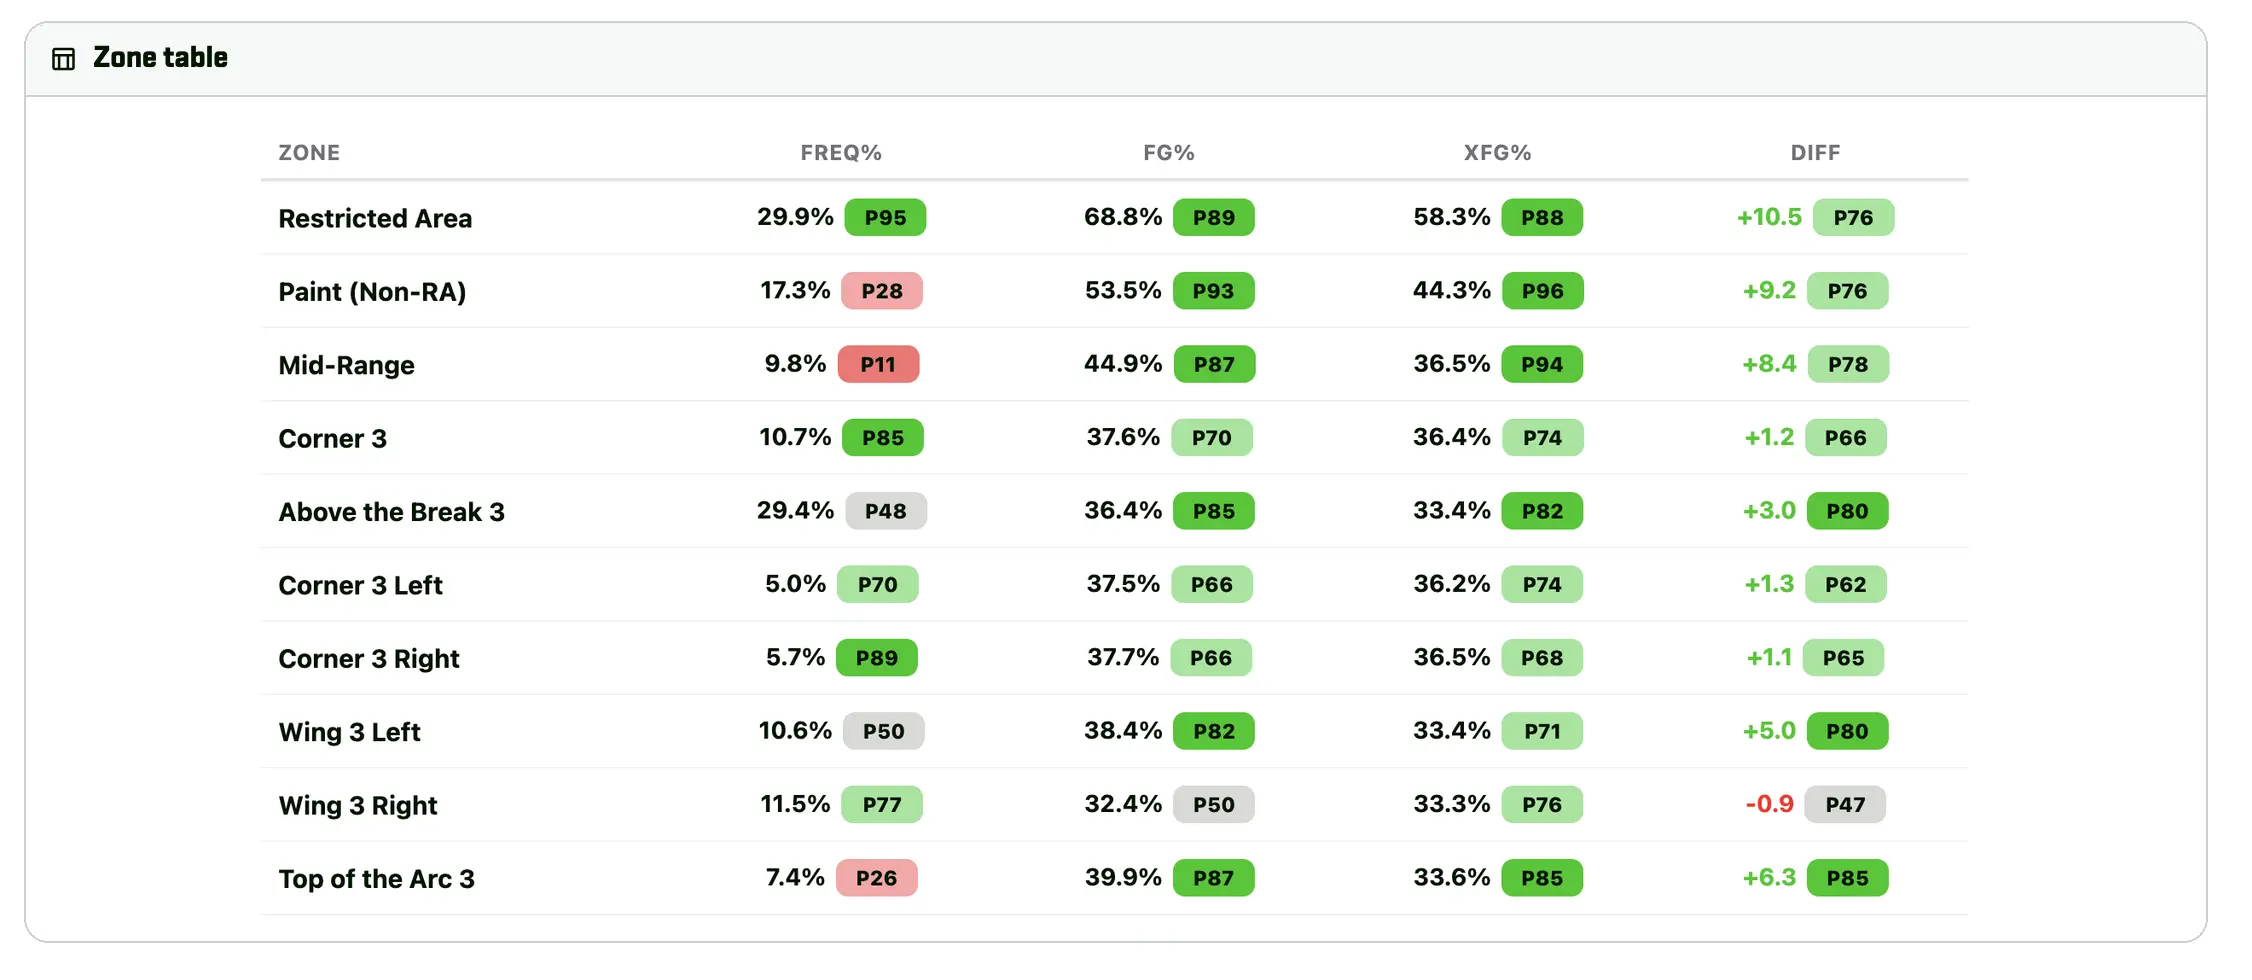
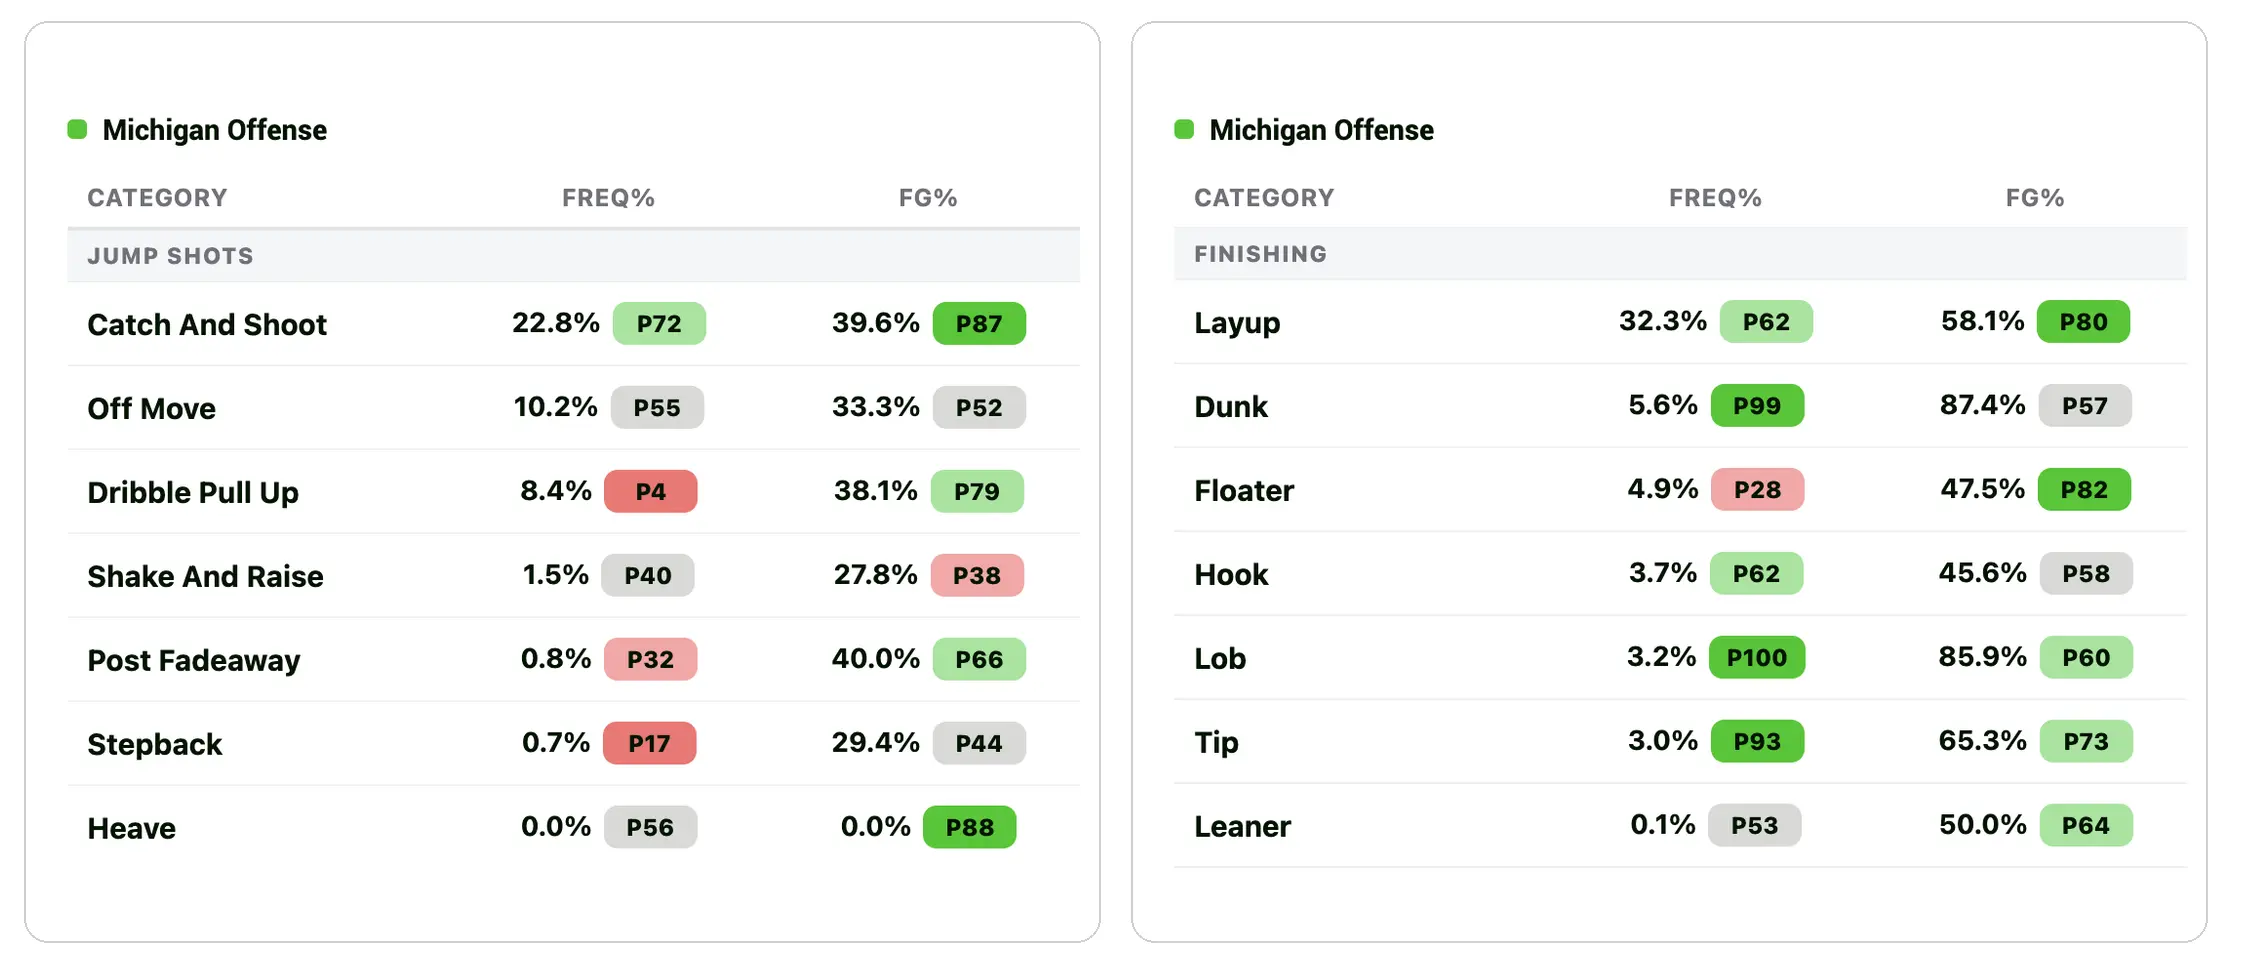
Michigan’s offense is built to get to the rim. They take 29.9% of their shots in the restricted area (95th percentile), and they rank near the top in dunks (99th percentile), lobs (100th) and tip-ins (93rd). Away from the paint they rely on ball movement. Catch-and-shoot attempts make for 22.8% of their shots (72nd percentile), and they love the corner three (85th percentile).
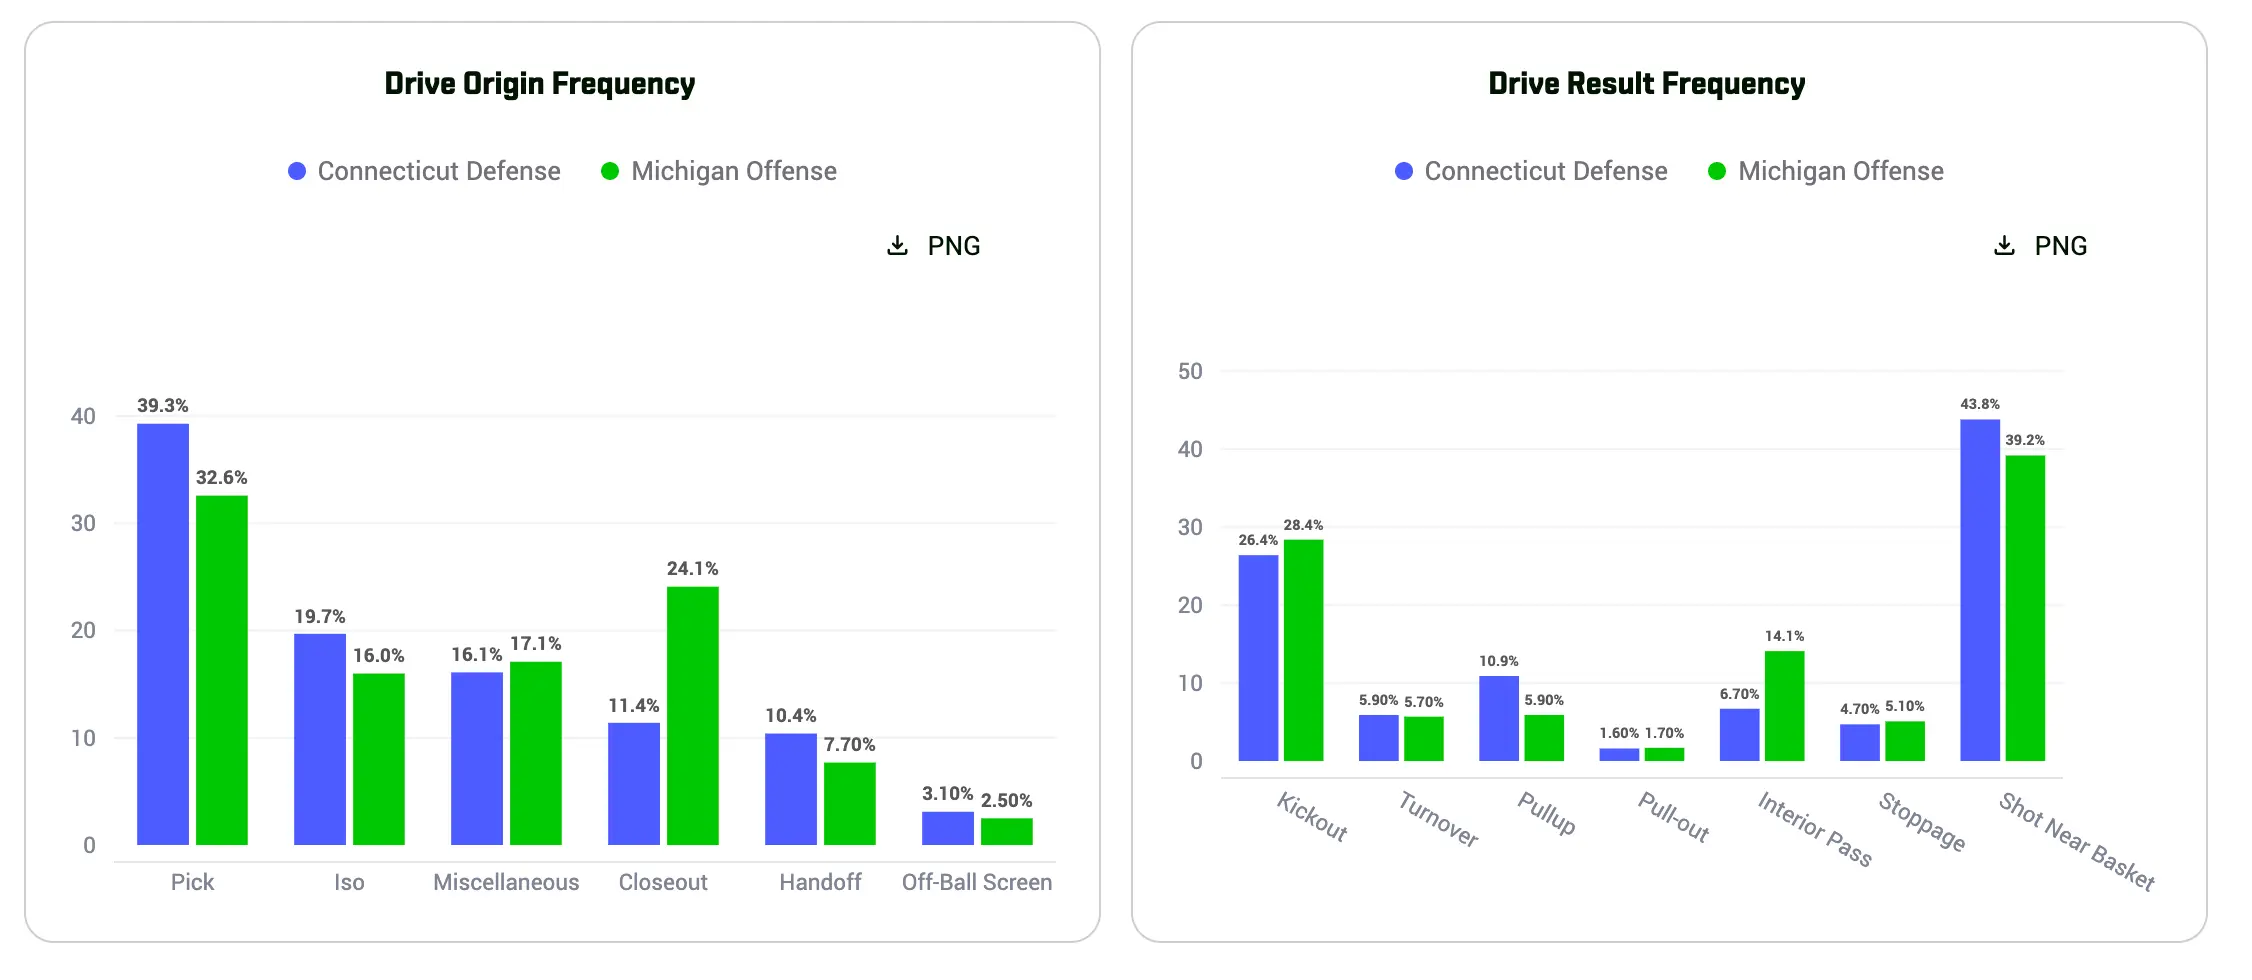
When we flip the view, the WebApp can show you what a defense takes away and what it concedes.
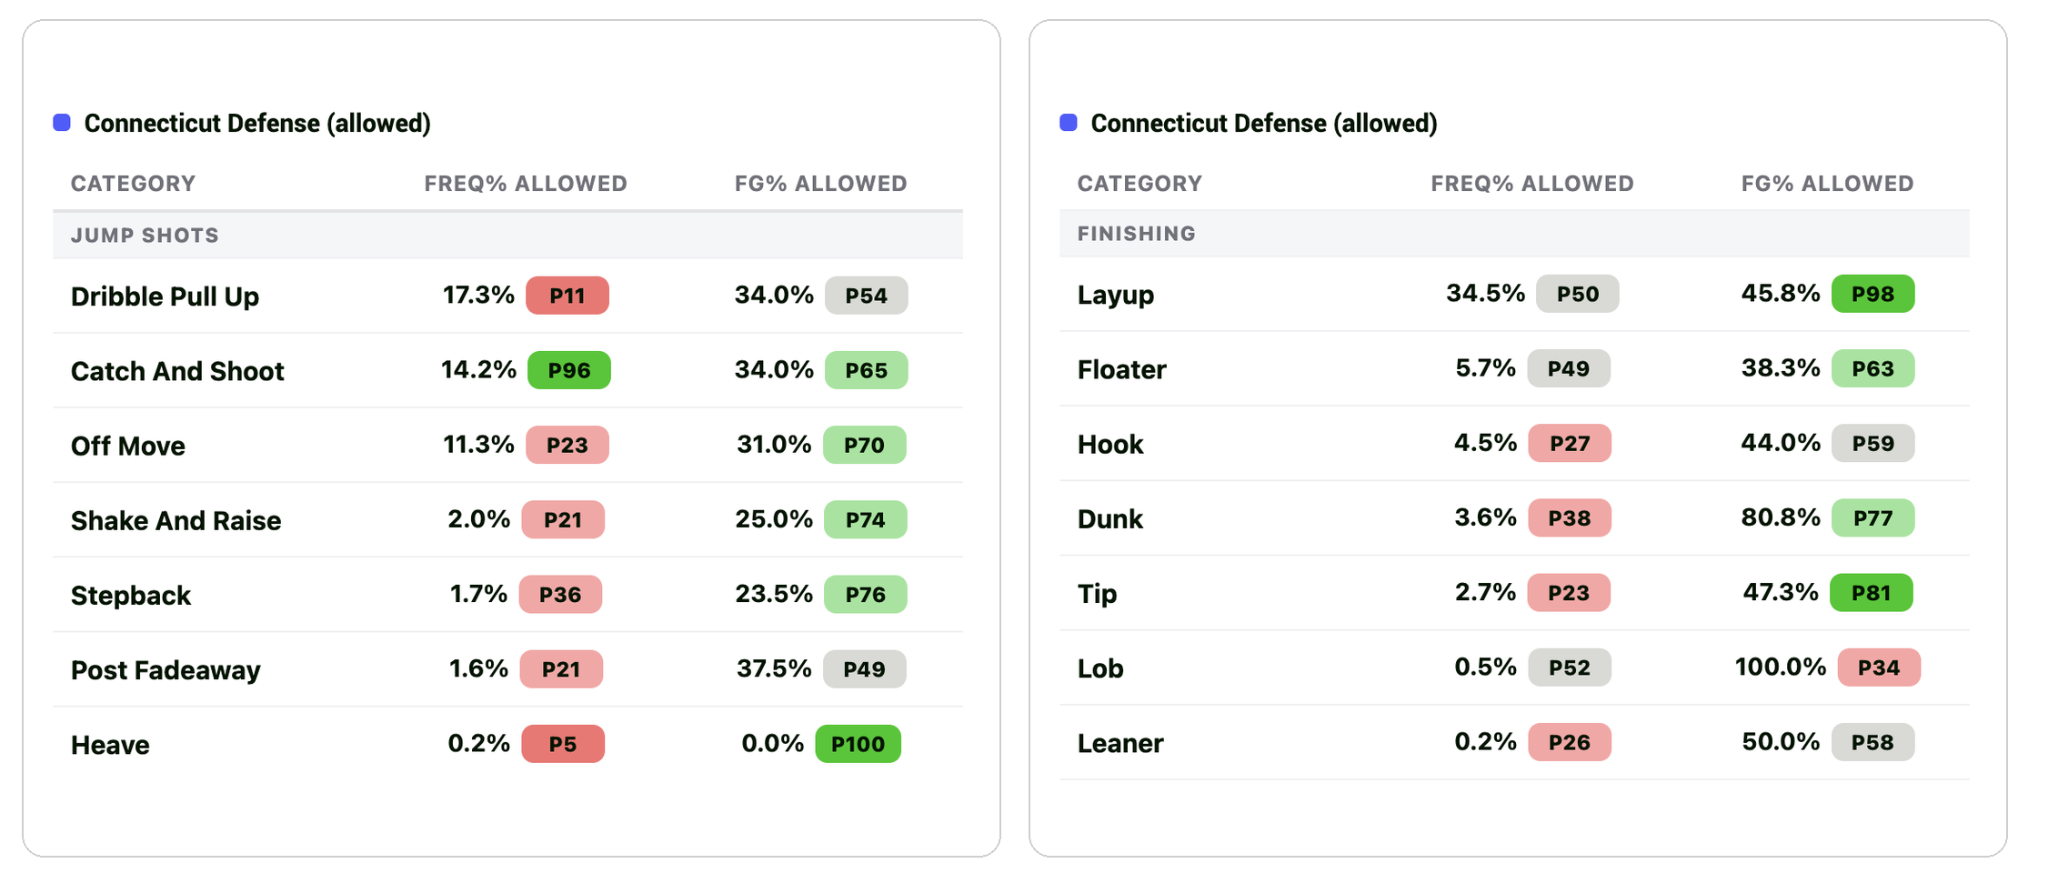
UConn’s defense operates like Fort Knox. They hold their opponents to an eFG% of just 46.0% (9.3 points below the league average). The paint is close to locked, and they effectively close the corners (88th percentile). Problem: that’s exactly where Michigan likes to shoot. What UConn concedes the most is pull-ups (17.3% of shots allowed, 11th percentile) and mid-range looks: two types of shots Michigan rarely takes.
So how can Michigan work around that defense?
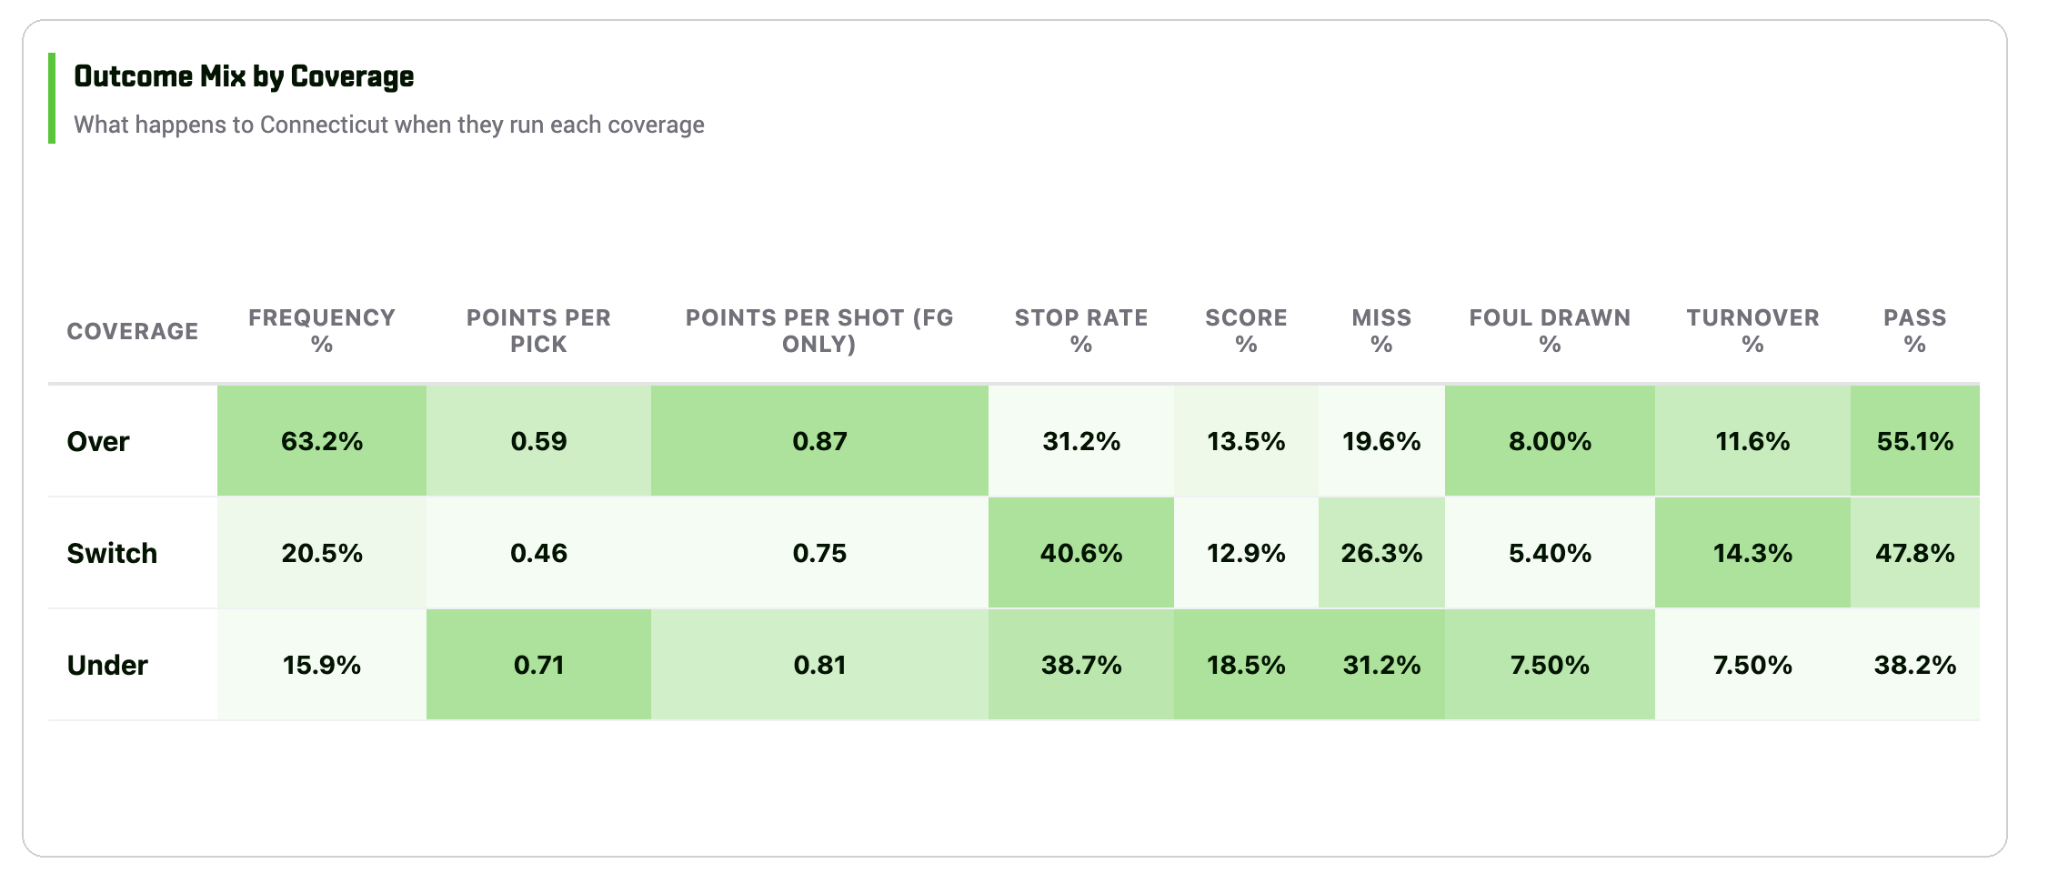
Pick coverage is one of our data points where our WebApp lets teams go deeper. The table above shows that UConn tends to go over the screen on 63.2% of picks. They’re at their best when it comes to switches: 0.46 points per pick and a 40.6% stop rate. Going under is where they are at their weakest, with 0.71 points per pick.
Michigan is a team that rarely pulls up (8.4%). UConn could therefore feel safer when needing to go under, not fearing that Michigan would try punishing it with a pull-up. This is exactly where the crack in the fort lies, because when Michigan actually does pull-up, they make 38.1%. They need to set their screens high and hard to make going under the most obvious option and punish it when it happens. Combine that insight with our player breakdown showcased in the video, and opportunities start to appear.
From Team Tendencies To Key Players
Teams have tendencies, but as in every sport, players make or break a game. We’ve illustrated in a previous article how the WebApp allows you to analyze a player in depth. In Game Preparation you can apply this data to better understand who the threat is on the opposing side. Which player is the most efficient and from where? Who do you need to keep away from the rim? To go more in depth, read Part 1 of our WebApp series.
Go Further With SkillCorner
To discover how SkillCorner’s rich data can elevate your game preparation and player analysis, get in touch today.