
Contextual Scouting: When your best player leaves
The article takes an experimental approach to scouting, asking whether the output of a departing star player can be recreated through a combination of complementary data profiles.
.png)

Heading
We Can’t Replace Him
When your best player leaves, many clubs instinctively look for the next star or a like-for-like replacement. It is an understandable reaction, but it often becomes an expensive and uncertain pursuit, as almost 50 per cent of ‘big transfers’ don’t deliver the expected impact (‘How To Win The Premier League’, 2023). Clubs are not only betting on one player to adapt quickly, but they are also entering a market where every team is competing for the same “next big thing”, which inevitably drives prices up.
This raises a broader strategic question: is there a smarter way to replace departing stars and reduce the risk built into recruitment?

The image above recalls one of the most iconic scenes from the movie Moneyball, where Oakland A’s scouts debate how to replace Jason Giambi. Billy Beane cuts through by arguing that they cannot replace Giambi directly, but they might be able to re-create his value in the aggregate. Instead of chasing one expensive superstar, they focused on the key performance indicator (KPI) that contributed most to winning baseball games, On-Base Percentage (OBP). The idea was to distribute Giambi’s total OBP across several undervalued players, allowing the A’s to compete in an uneven market. No single signing was a perfect match, but collectively they managed to replace Giambi’s OBP value.
Translating this idea to football is less straightforward. Baseball is a highly structured sport with isolated events, while football is a dynamic invasion game with constant interactions. However, the underlying Moneyball principle remains the same. If we can identify a metric or a set of metrics that consistently correlates with increasing scoring probability and ultimately winning matches, then we can break down a player’s impact and examine whether that value can be reproduced across multiple roles rather than through a single high-risk signing.

Expected Threat as KPI
This is where expected threat becomes an interesting starting point. By analysing how a player advances the ball into dangerous areas, we can quantify the part of their game most closely tied to creating goal-scoring opportunities or increased danger. Since football is a low-scoring sport, the most valuable contribution to the target is a player’s role in generating chances. Once we understand the components of their xT profile, we can explore whether several targeted, cost-efficient signings can collectively reproduce that influence.
In order to not make the calculations overly complicated, we will focus on finding metrics that we believe represent progression and chance creation (essentially xT). This can also make it easier to scout and pick the metrics that certain positions should excel in inside our squad composition.
Re-Creating A ‘Star’ Playmaker
The scenario we are imagining is that our star creator leaves. This is a player who receives the ball both in the Create phase and the Finish phase. In practice, that means we’re trying to replace someone who helps progress play after the initial Build Up phase and someone who is central to our chance creation in the final third. Players who influence multiple phases like this are hard to replace. They don’t appear often, and when they do, they come with heavy price tags.
To approach this problem, we will break creative impact into clear components. The idea is to separate their progressive qualities through Forward Momentum actions, their ability to advance play through 8-metre Carries at Speed, and their Pass Attempt Share to Runs Ahead of the Ball. We then combine this with their Avg Expected Threat (xT) Per Pass Attempt into Off Ball Runs to assess which players that picks out the most dangerous passing options on average. By isolating these elements, we can understand which parts of the profile can be reproduced by different players. Later, we will also look at how we can replace their impact in the final third or the Finish phase.
Performance Index for Progression
- Count Forward Momentum Possessions In Create
- Count 8M Carries Above Running Speed (all phases)
- (Share, %) Pass Attempts to Runs Ahead of the Ball / Pass Opportunities to Runs Ahead of the Ball In Create
- Avg xThreat Per Pass Attempt to Off Ball Runs
Below are the results of our index ranking filtered for U23 Midfielders in the top five leagues from the 24/25 season.
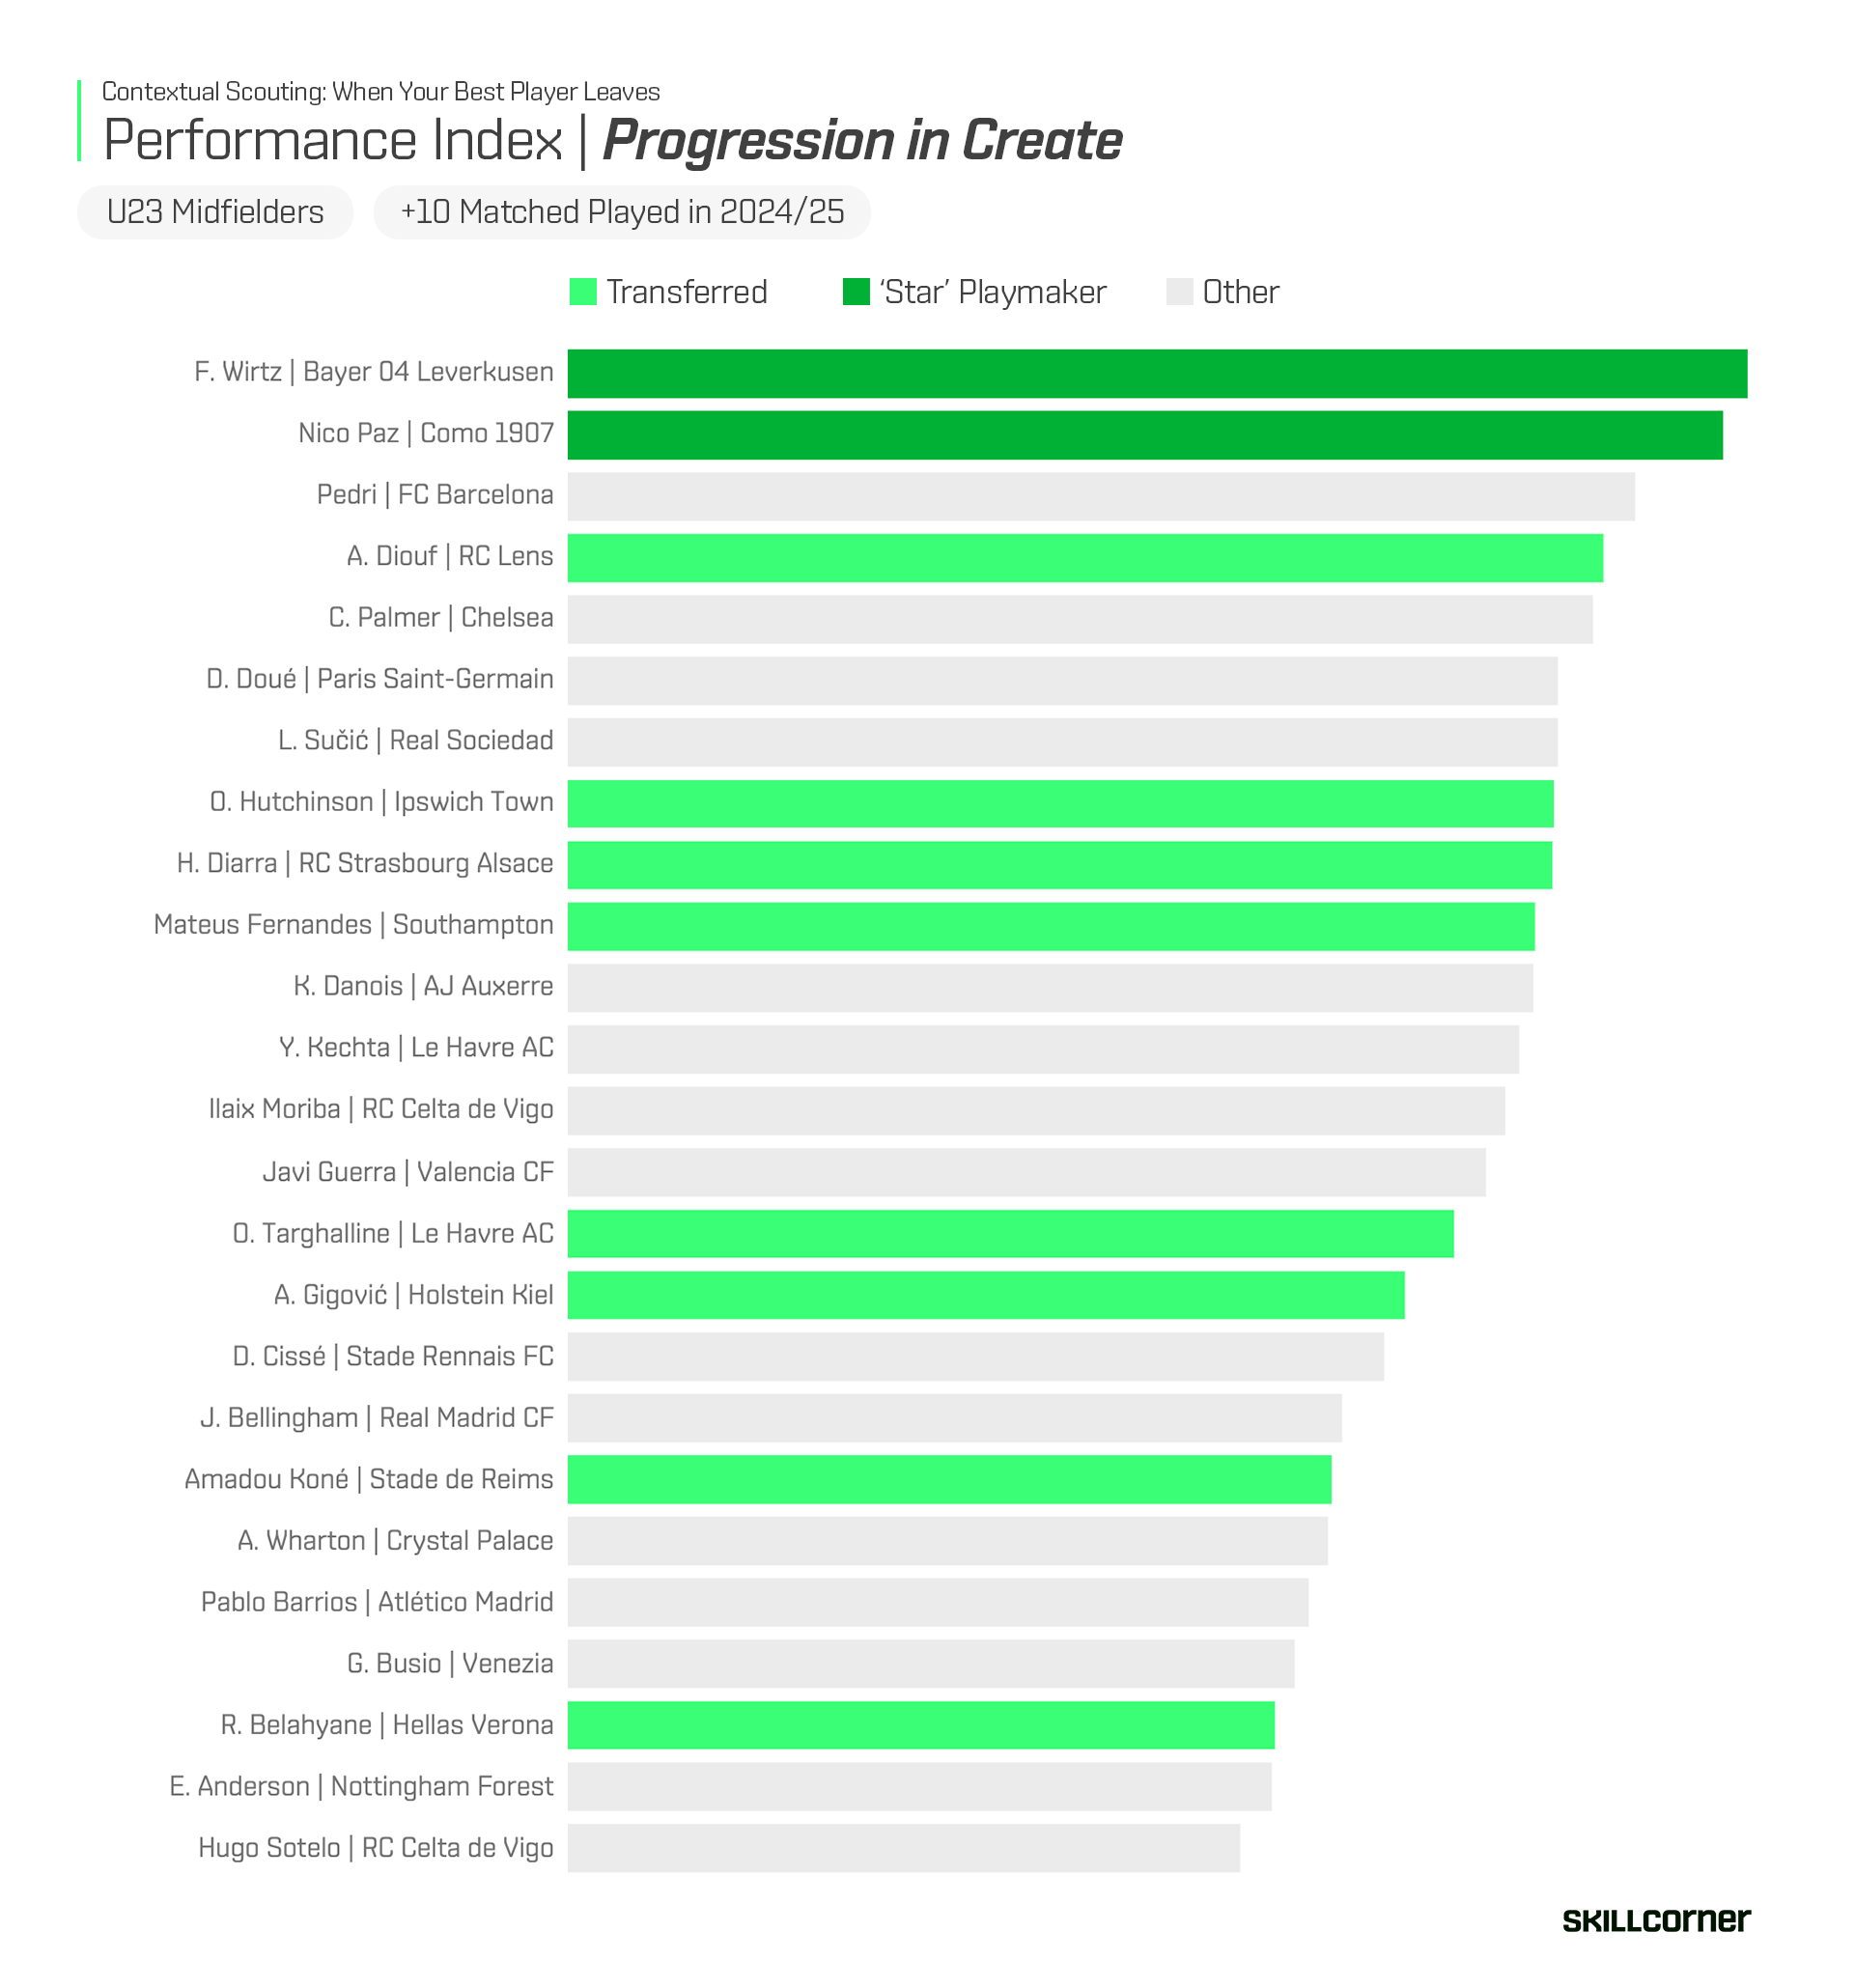
At the top of our ranking is Florian Wirtz, a player many would say has struggled to make an immediate impact at his new club. Last season he was arguably the best creator in Europe for Bayer Leverkusen, something we also highlighted in our previous Contextual Scouting piece on The Modern Playmaker. In second place is Nico Paz, a breakout performer for Como in Serie A. Real Madrid still owns his rights and there has already been plenty of speculation about a return to the Spanish capital.
This gives us a useful starting point. How do you replace a star creator like Wirtz or Paz?
Staying true to our initial argument about comparing players Expected Threat, we have ranked our progressive list by their Avg xT Per Pass Attempt To Off Ball Runs below:
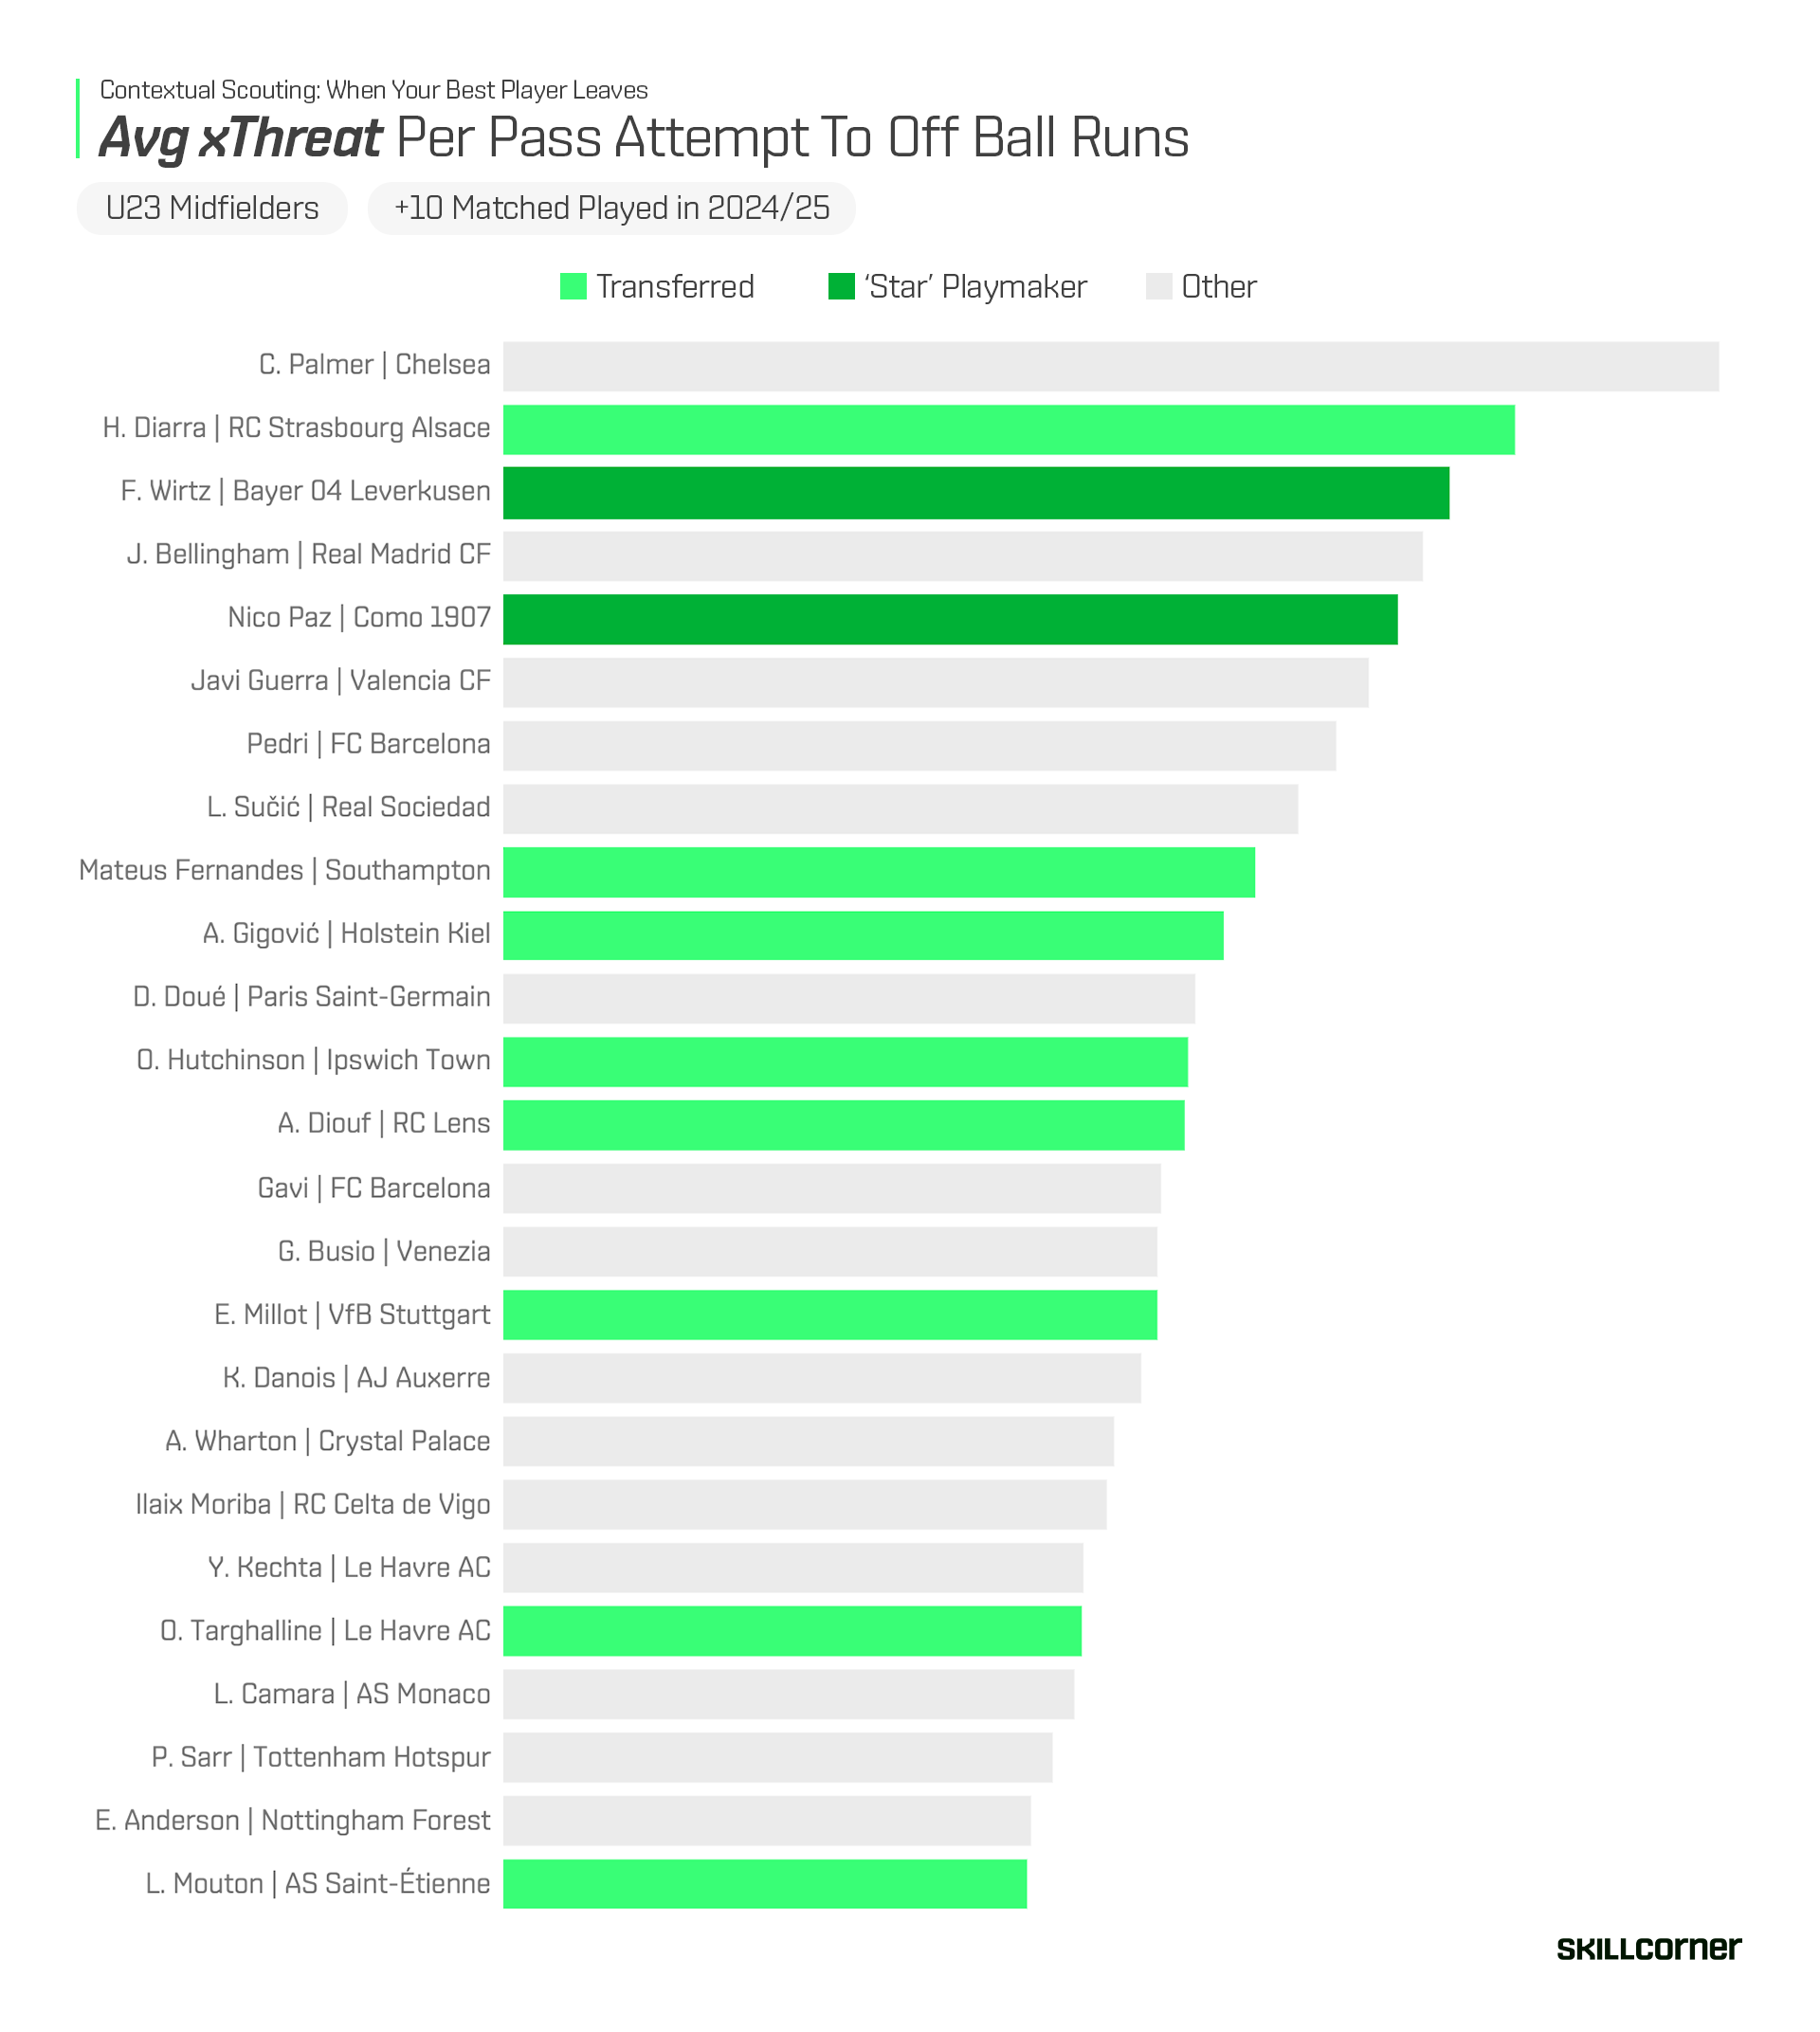
At the top of the ranking we find Cole Palmer, averaging 4 per cent threat per pass attempt to off ball runs. In practical terms, this implies that if 100 passes were completed, around 4 would be expected to result in a goal within ten seconds. In terms of pass selection, Palmer averaged 2.1 pass attempts to runs in behind (85th percentile) and 1.1 pass attempts to cross receivers (89th percentile) in the English Premier League.
In second place is Habib Diarra, who moved to Sunderland ahead of the season. His strong xT per attempt is largely explained by a distinctive movement and passing profile. During his time in France, he ranked in the 95th percentile for overlap runs, the 87th percentile for underlap runs, and the 96th percentile for pass attempts to cross receivers, averaging 1.45 such passes per 30 TIP. These passes are particularly valuable because cross receiver runs typically generate higher xT, as they target teammates attacking the most dangerous areas inside the box. Diarra’s profile therefore illustrates why xT should not be assessed in isolation. His output is driven by a specific combination of movement and pass selection that consistently funnels the ball into high threat zones.
A similar pattern can be observed for Florian Wirtz, who ranked in the 98th percentile for both pass attempts to runs in behind and to cross receivers in the Bundesliga prior to his move to Liverpool.
The rest of the xT ranking mixes established elite players at major clubs with more under the radar talents who were on the move ahead of this season. With that in mind, we will focus on a selection of profiles that remain at their clubs and examine how they perform across the different components of our Progression Index.
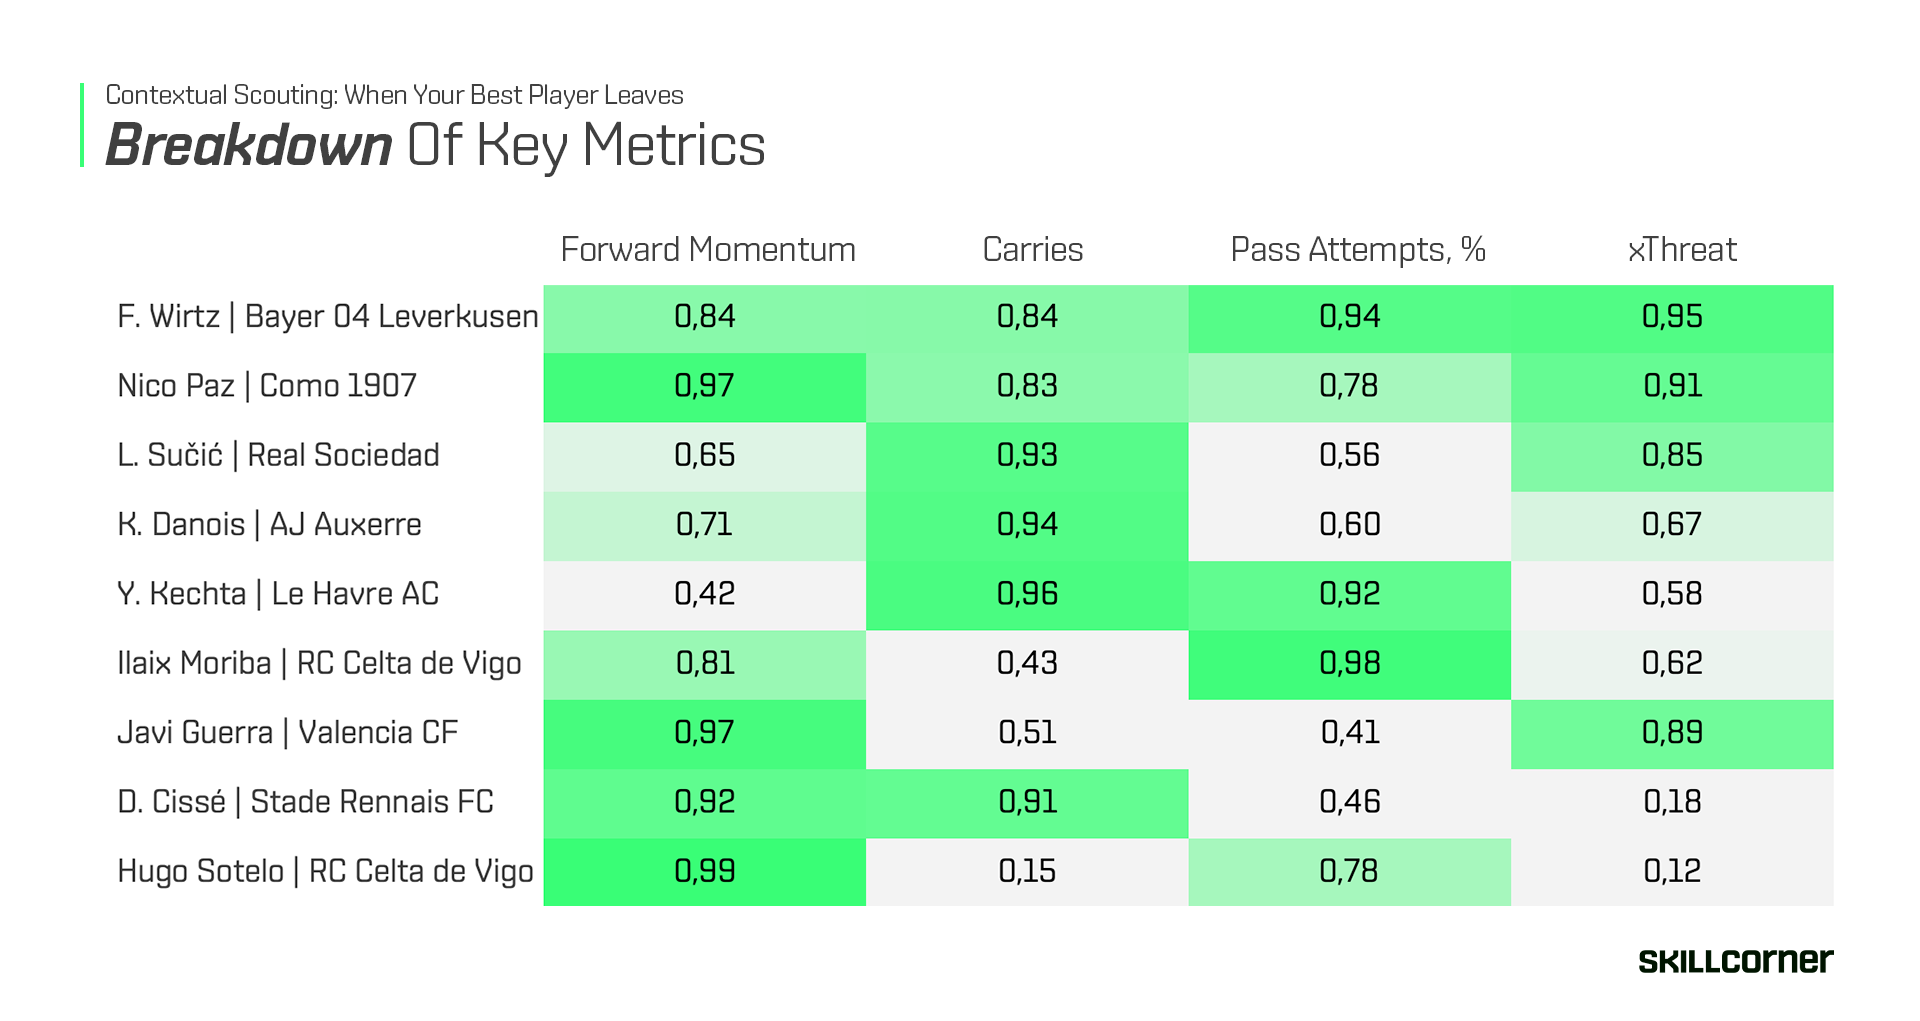
When we break their profiles into percentile scores, we get a clearer picture of where each player stands out. Both Wirtz and Paz are exceptional across most metrics that make up the Progression Index. The question becomes whether we can split their combined contribution across two midfielders instead of one.
An Experimental Approach
Take Ilaix Moriba and Luka Sučić as an example. Moriba ranks fairly high for Forward Momentum In Create but averages a higher pass attempt percentage to runs ahead of the ball than Wirtz and Paz.
Sučić, meanwhile, ranks above both Wirtz and Paz for Carries Above Running Speed across all phases of play, and his xT from Passes to Off Ball Runs is close to their level.
This sets up an interesting comparison. If we combine Moriba’s strengths with Sučić’s, can their profiles collectively match the overall output of the elite playmakers at the top of the ranking?
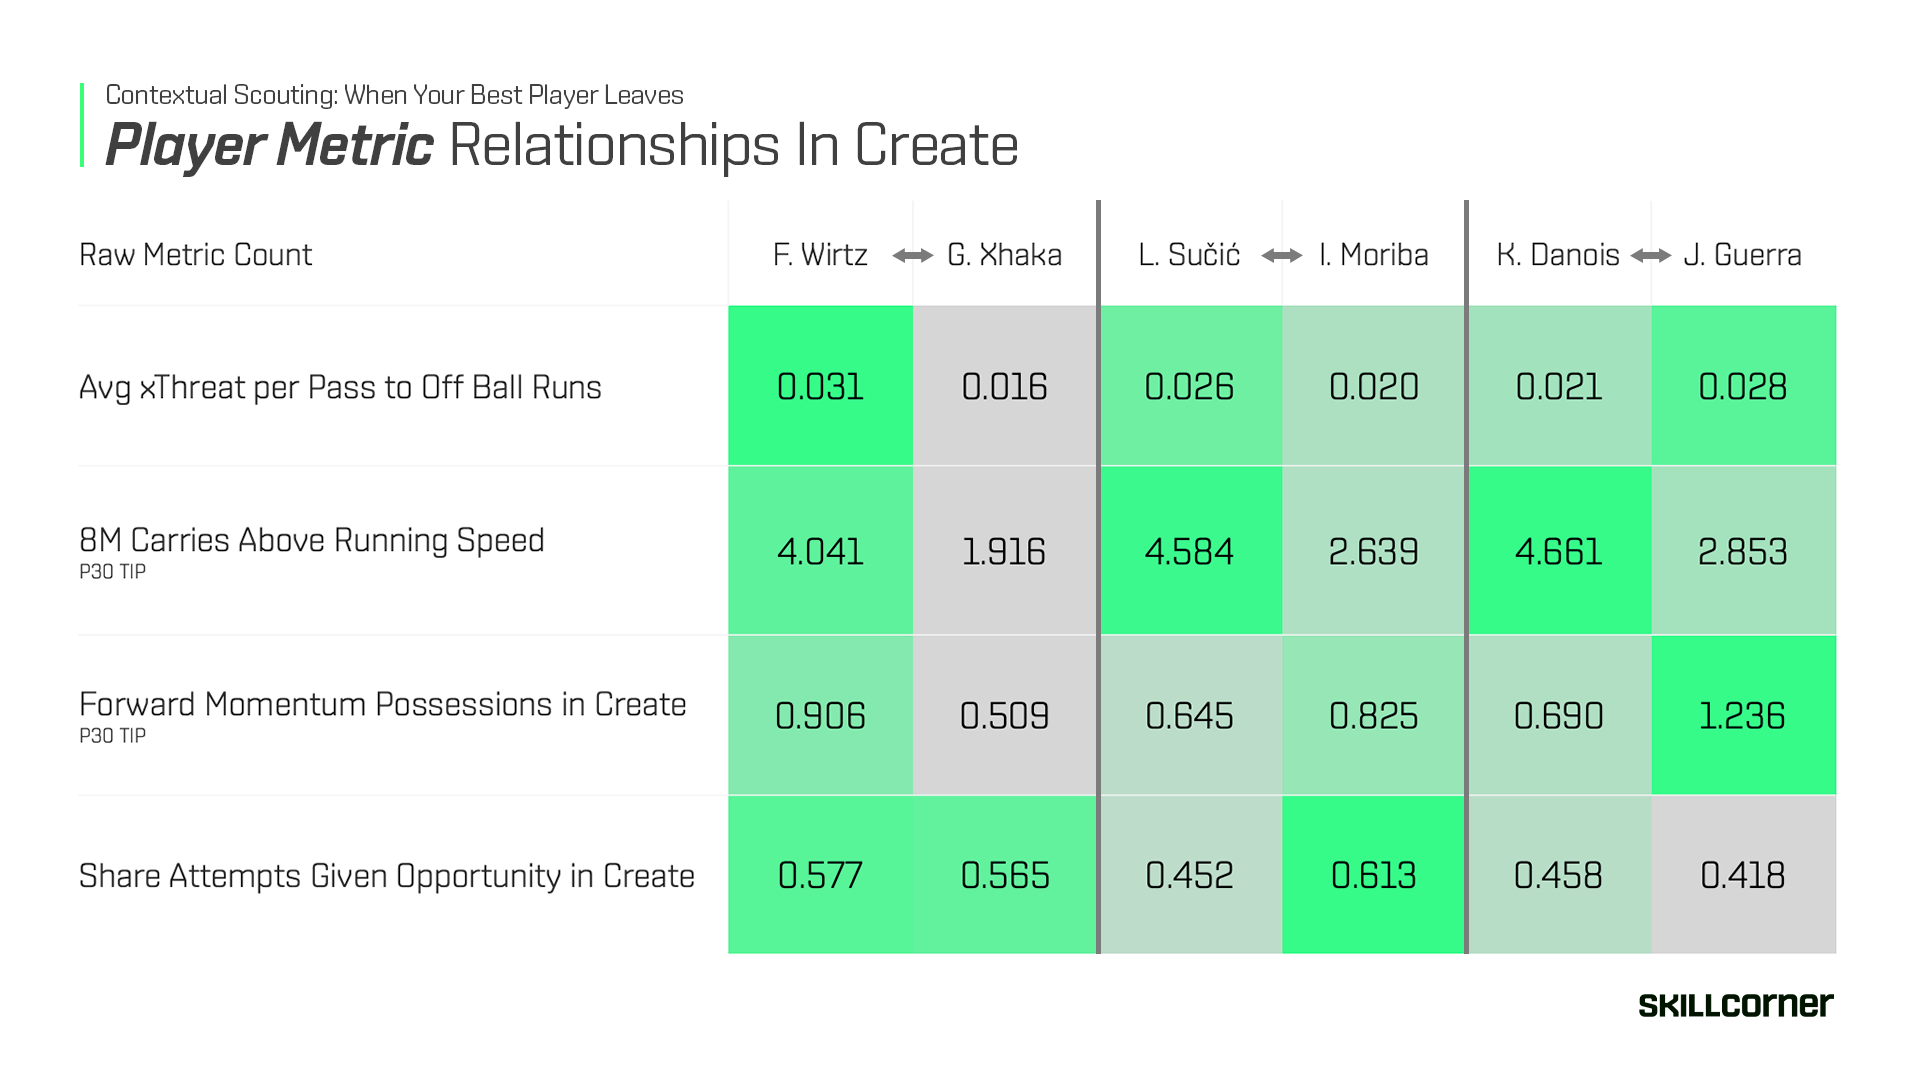
Above, we have handpicked a group of midfielders and pulled their raw metric counts to explore how different pairings might complement each other on the pitch. The idea is simple: instead of looking at players in isolation, we assess how two profiles can combine their progressive skillsets and behaviours.
As a reference point, we use the Wirtz and Xhaka partnership from last season. Their distribution of strengths is a useful template. While Wirtz stands out in almost every creative metric, his impact is unlocked by having someone who can feed him the ball consistently. That is exactly what Xhaka provided him in Leverkusen. His high Pass Attempt Percentage (57 %) to Runs Ahead of the Ball in Create shows how Wirtz was given the platform to receive up the pitch.
The question is whether we can construct something similar, or even deliberately different, by combining complementary profiles.
The first example is Sučić and Moriba, of Real Sociedad and Celta Vigo, respectively. Moriba is an aggressive passer (98th percentile), even exceeding Xhaka’s pass attempt percentage to Runs Ahead of the Ball in Create. Sučić brings the ball-carrying ability (93rd percentile) and dangerous passes to off-ball runs (85th percentile for xThreat per Pass Attempt). Together, they recreate a similar division of labour: Moriba acting as the deeper distributor and Sučić as the dynamic carrier who accelerates play.
The second example is Danois (AJ Auxerre) and Guerra (Valencia), who form a more direct and high-impact pairing. Guerra excels in Forward Momentum In Create and brings a willingness to drive possessions forward rather than sitting as a fixed six. Danois adds strong carrying output (94th percentile) of his own, and both score well in xThreat per pass attempt, particularly Guerra.
None of this is perfect science, but it gives us a structured way to think about how to build a midfield based on complementary strengths and skillsets using data. It also helps clarify what kind of behaviours we want: do we prioritise carrying, passing aggression, or the ability to generate threat from fewer passes? And in which positions do we deem the different characteristics important?
For example, If we wanted a steadier number six profile in a 4-3-3, someone like Hugo Sotelo would enter the conversation. He ranks highly for Forward Momentum but has a much lower threat per pass attempt, suggesting he prioritises keeping possession and distributing balls to his teammates from his No. 6 position. Threat levels will also be lower for players operating closer to their own goal, and increase closer to the opponents goal which aligns with this positional profile.
These scenarios and comparisons help us map out the trade offs and build a midfield that fits the desired game model rather than chasing one direct player replacement.
Up to this point, our scouting has focused on players with strong progression qualities and high xThreat output. Those metrics help us identify profiles that move the ball into valuable zones and consistently create danger for teammates. What they do not capture is the final step, which is whether those actions actually translate into shots. And since football is a low scoring sport, understanding who regularly drives their team into shooting positions becomes essential.
Re-Creating Output: Shot Creating Actions
To identify players who reliably create or arrive in shooting situations, we break their contributions into three distinct buckets of actions that results in shots in the Finish Phase:
- Carry Ending in Shot (In Finish Phase)
- One Touch Shot (in the Penalty Area)
- Carry and Pass Leading to Shot (In Finish Phase)
In the bar chart below, we rank midfielders by their combined distributions across the different shot buckets on a p30 TIP level (adjusted for teams’ possession):
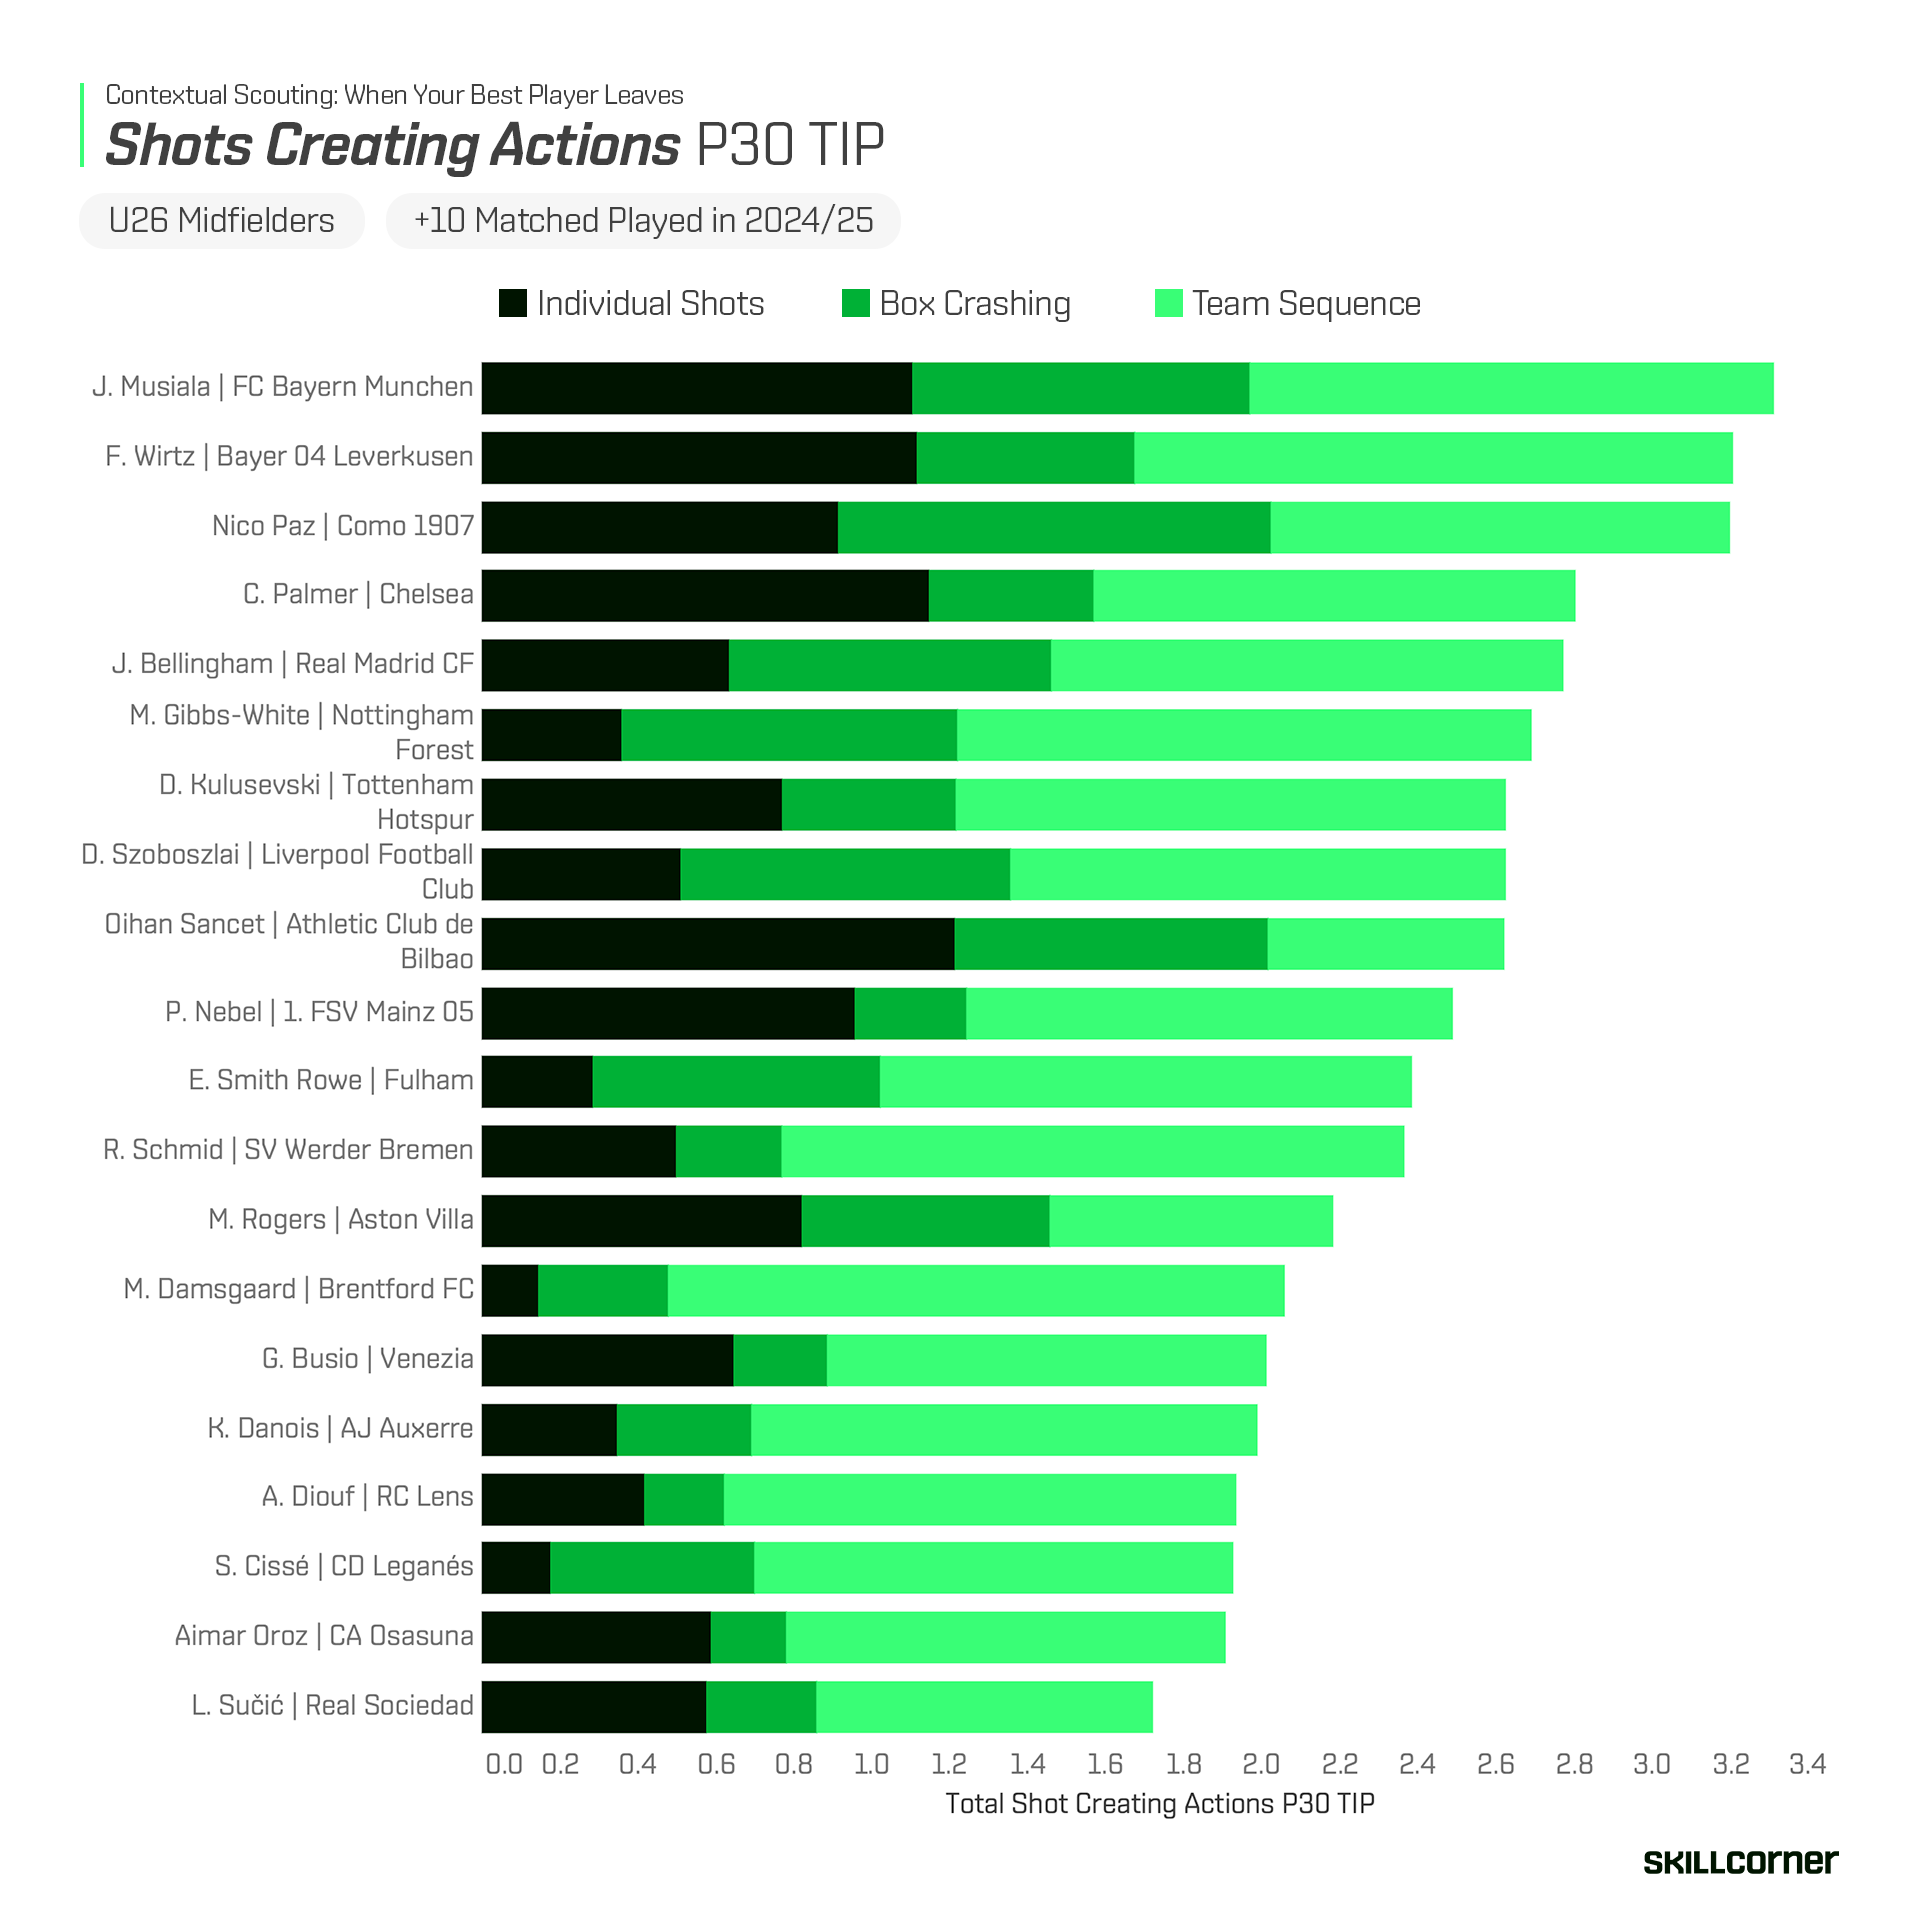
The bar chart above ranks U25 midfielders from Europe’s top five leagues based on their combined Shot-Creating Actions (SCA) from last season.
Topping the list is Jamal Musiala, who recorded 3.3 SCA per 30 minutes of Team In Possession (P30 TIP). He is closely followed by Florian Wirtz and Nico Paz, the only other midfielders to average more than 3.0 shot-creating actions.
What distinguishes this trio is their balanced creative profiles. Their output is relatively evenly distributed across the three key categories:
- Individual Shots: Individual carries and shots (Black).
- Box Crashing: Arriving in the box for one-touch finishes (Green).
- Team Sequence: Carry and pass leading to a shot within 10 seconds (Light Green).
Notably, Nico Paz led the top 20 for "box crashing," averaging 1.1 one-touch shots in the penalty area P30 TIP, highlighting his tendency to arrive in the box from midfield.
Specialisation vs. Versatility
As we move down the rankings, players tend to show more specialised, uneven distributions. For many, passing within the finish phase accounts for the vast majority of their shot creating contributions. One example is Kevin Danois, who also featured in our earlier progression index.
However, since players who excel across all three creative "buckets" are rare, recruitment strategies could involve pairing specialized players to share the creative load. To explore alternatives to central creators, we will now shift our focus to Wide Attackers, who naturally find themselves in high-value chance-creation zones more frequently.
The following charts analyze the shot-creation distributions for U25 Left and Right Wingers from the 24/25 season:
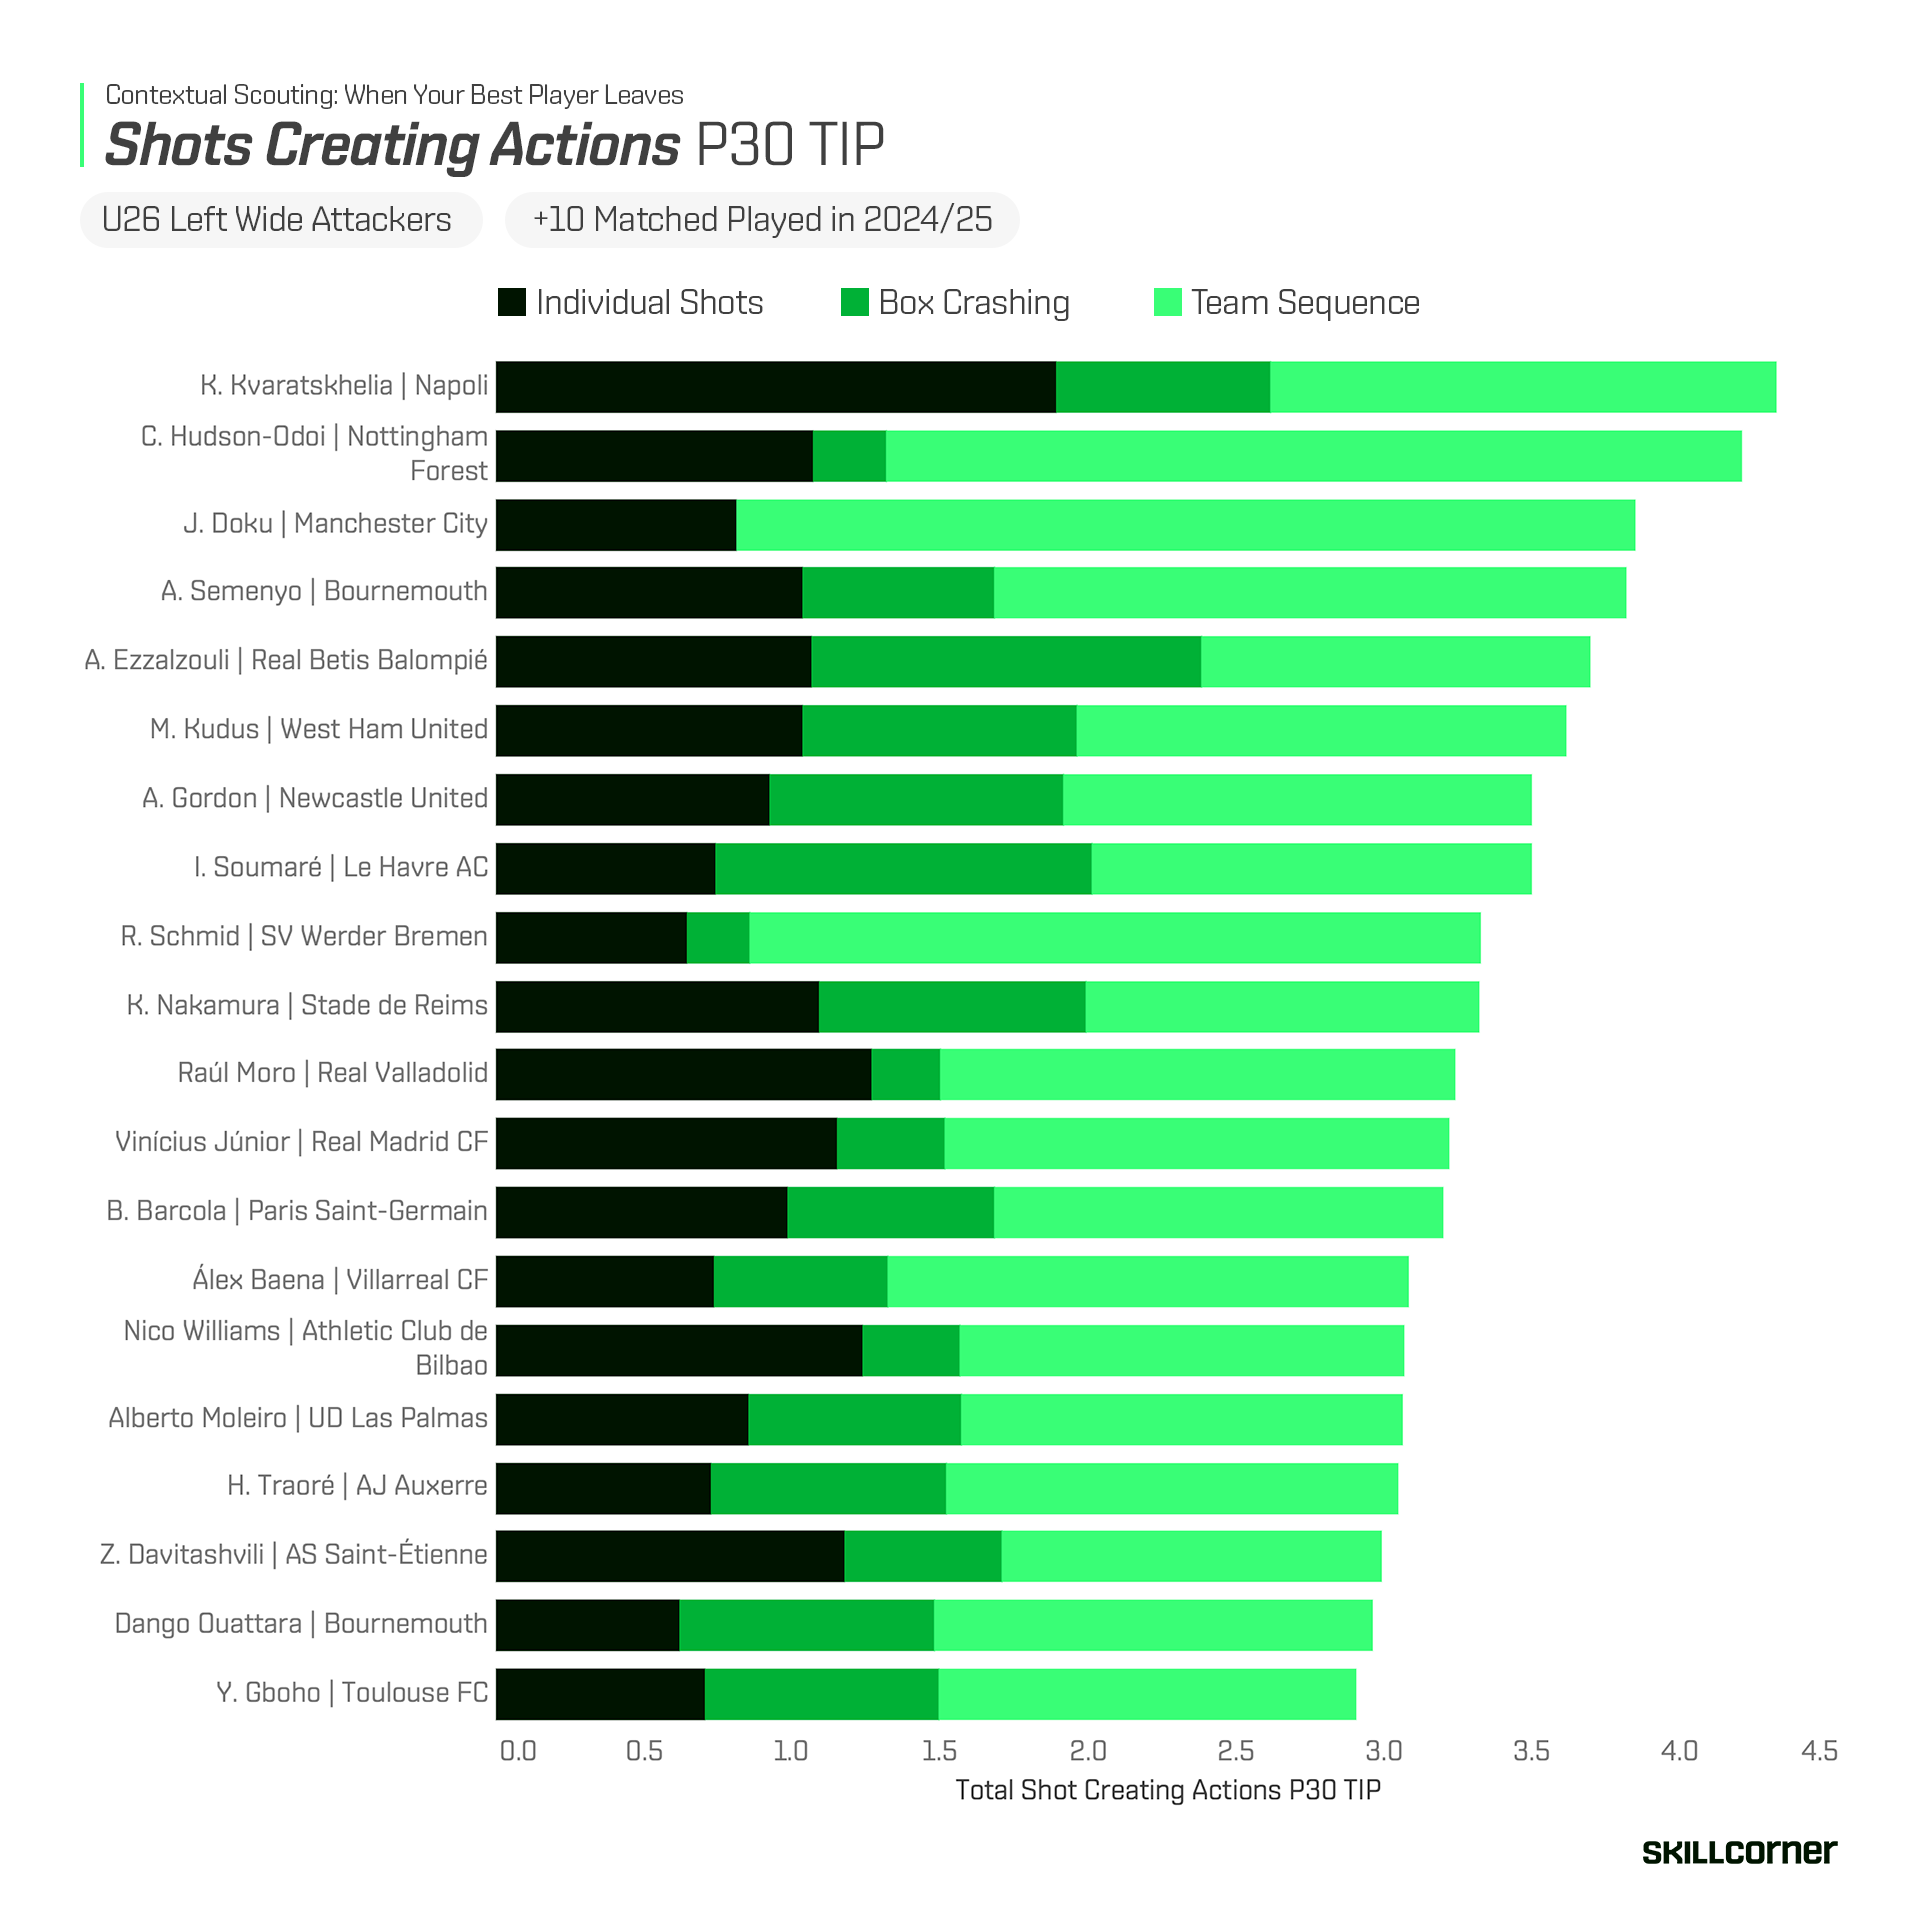
Leading the rankings for Left Wide Attackers, Khvicha Kvaratskhelia stands out with 4.3 shot-creating actions (SCA). His profile is skewed toward individual brilliance, with 44% of his output generated from direct carries followed by his own shots while playing for Napoli.
In contrast, Jérémy Doku displays a different tactical utility; 79% of his actions stem from carries that culminate in a pass or cross. Finally, Abde Ezzalzouli represents a more balanced profile across all three creative "buckets." However, he notably leads this group in "box crashing," recording 1.36 one-touch shots in the penalty area P30 TIP.
Lets also have a look at the Right Wide Attackers from last season:
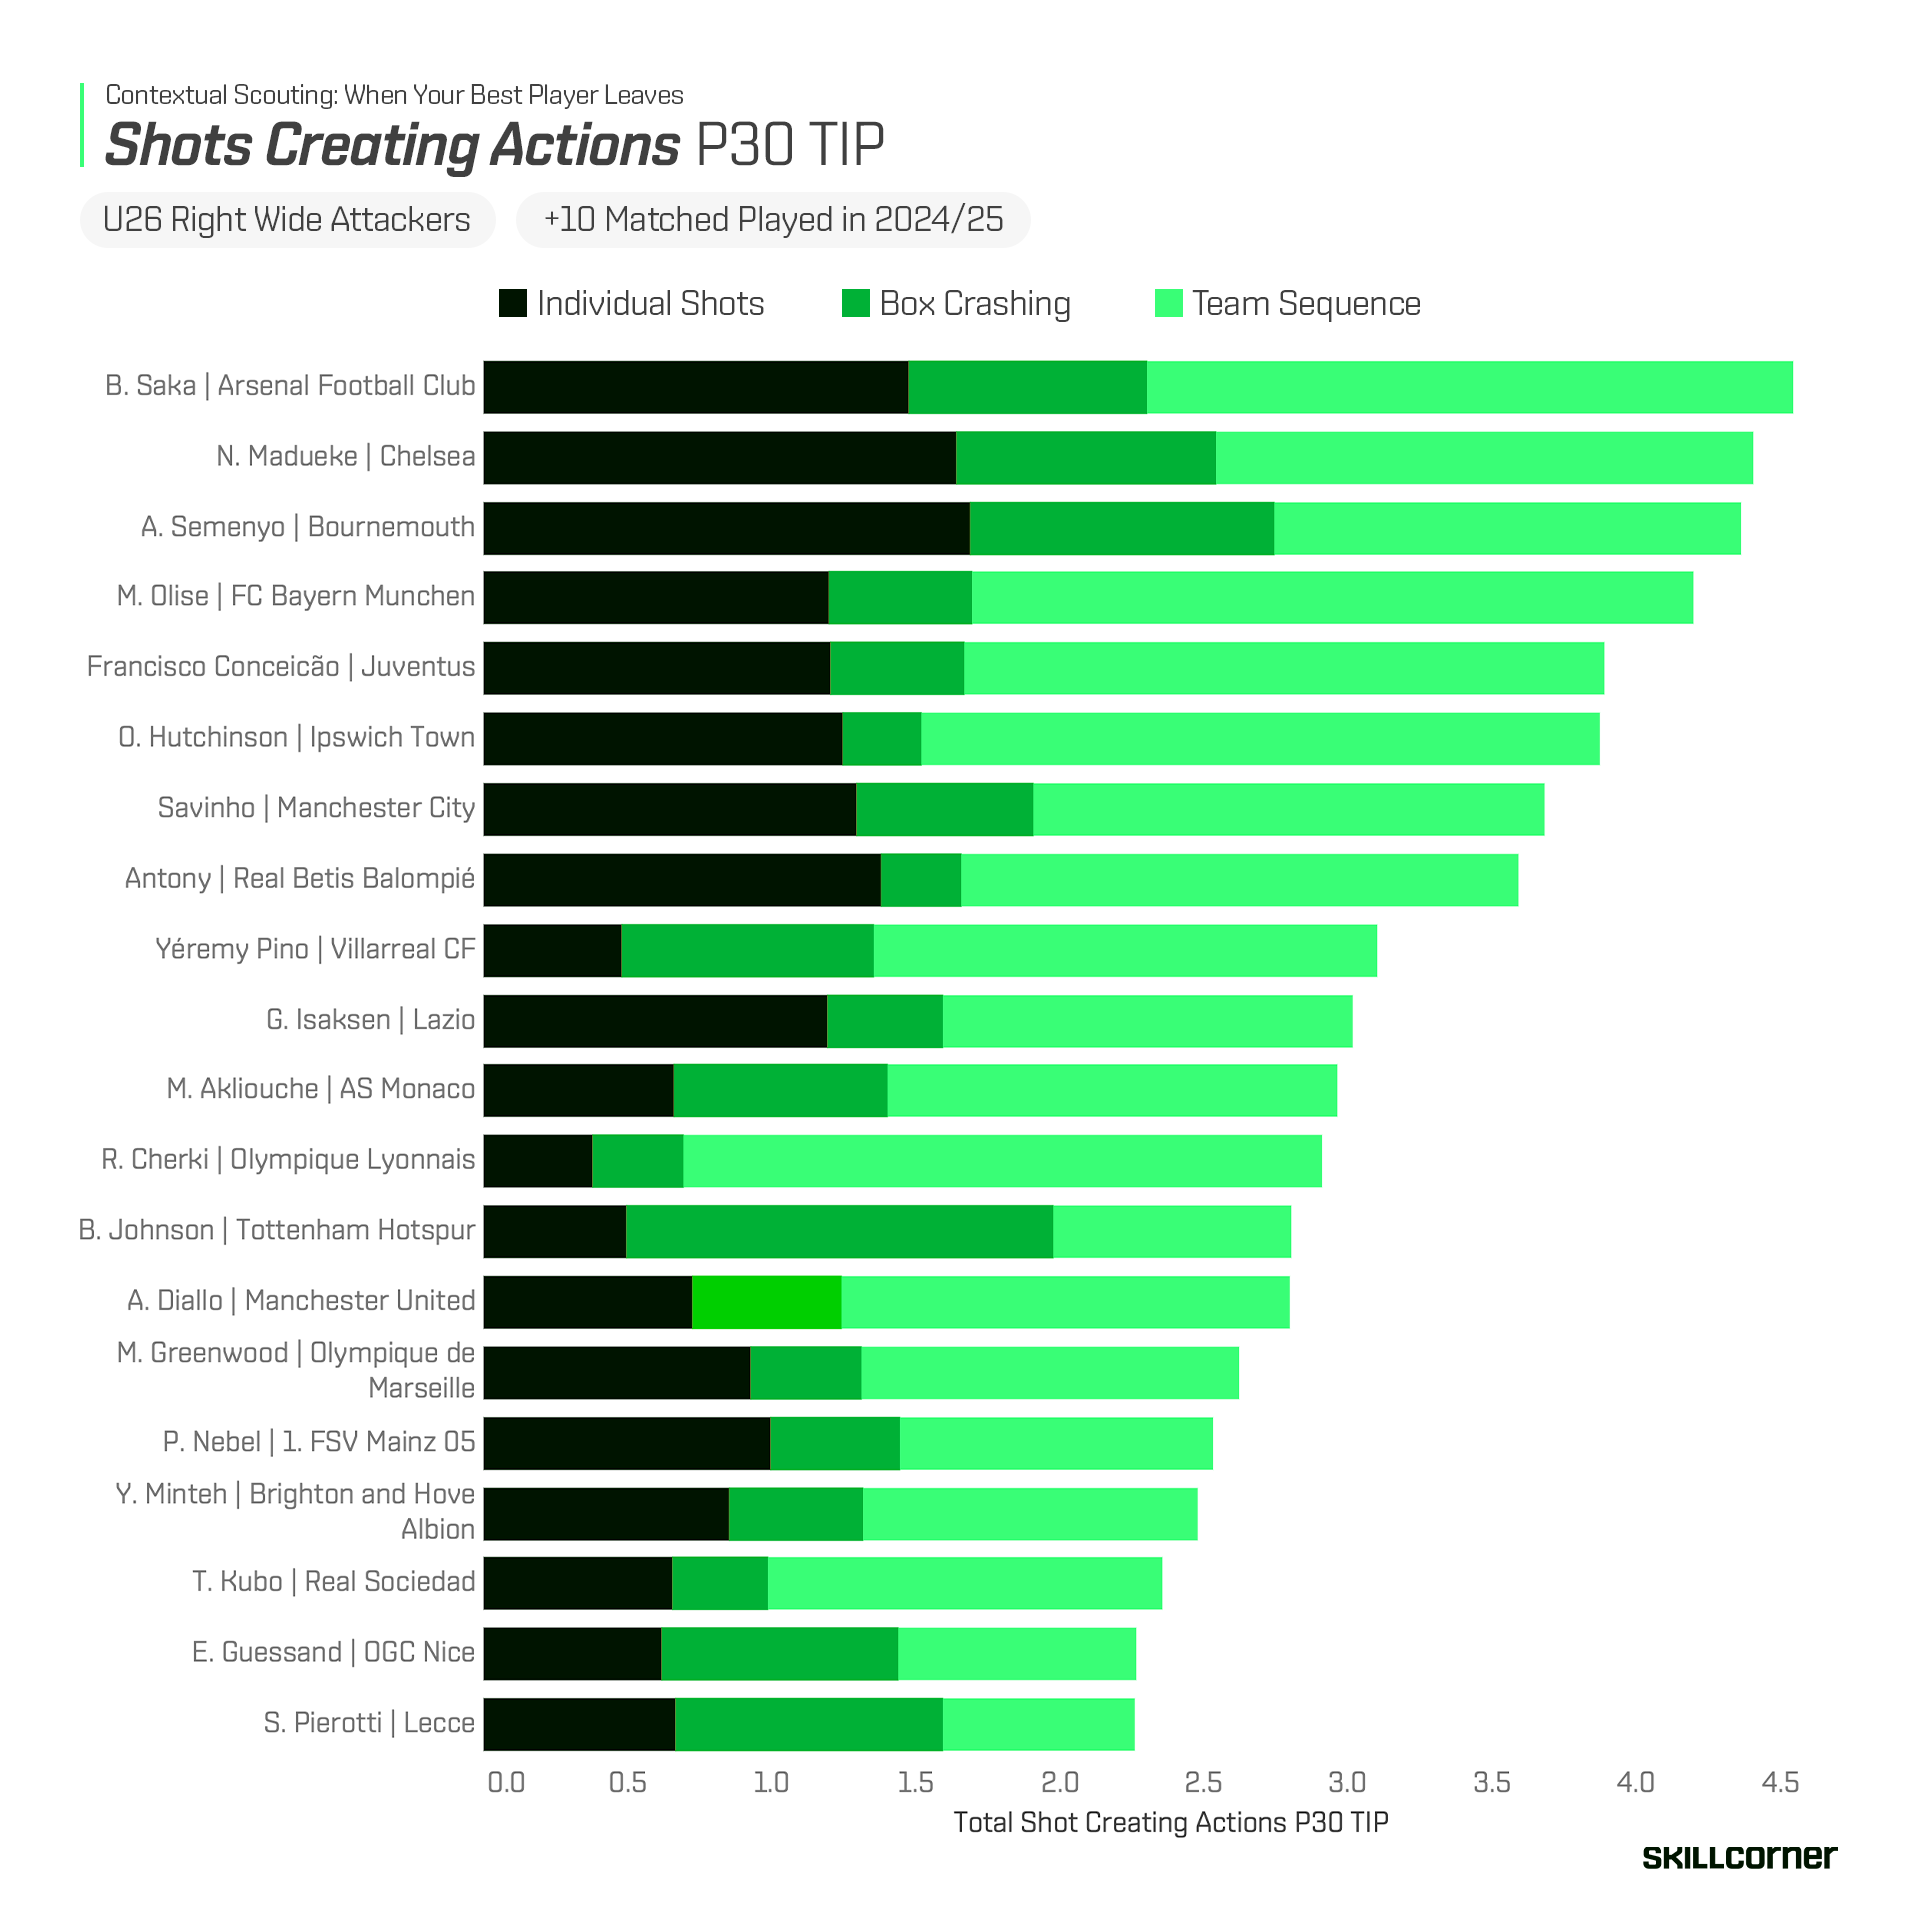
On the right flank, Bukayo Saka recorded the highest average score with 4.6 SCA, closely followed by Noni Madueke and Antoine Semenyo. It is worth highlighting that Semenyo ranked in the top five in both charts, underscoring his rare output and making him a versatile target for elite clubs. When compared to Doku and Cherki, whose profiles are more heavily skewed towards passing and chance creation, Semenyo stands out as a more direct goal threat. This helps explain why he offers Manchester City a different attacking dimension and an additional source of goals alongside Haaland. His unpredictability further strengthens his profile, as he is comfortable attacking on both sides and finishing with either foot, scoring six goals with his right and five with his left last season.
Further down the rankings, Brennan Johnson recorded the highest "box crashing" score. This aligns with the "eye test," as he frequently arrived at the back post for tap-ins last season (a trait and movement that secured his team the trophy in the Europa League Final as well). Other profiles, such as Antony or Gustav Isaksen, post higher total SCA scores than Johnson but rely more on ball-carrying and individual shooting rather than off-the-ball movement into the box.
The “Mix and Match” Strategy
Rather than pursuing rare, "all-in-one" playmakers who command substantial transfer fees, we can adopt a "mix and match" strategy: distributing creative responsibilities across multiple positions.
By breaking down shot creating actions, we can distinguish players by how they help create shots for their team. This allows us to scout more precisely, targeting players based on the specific types of actions we want to increase in our own attack.
Based on the analysis so far, we now aim to assemble a complementary set of players that, collectively, could replace the output of a departing star playmaker.

For shots generated from carries, both Ezzalzouli and Isaksen cover this bucket well. In box crashing actions, Ezzalzouli stands out with the highest output, while for passes leading to shots within a team sequence, all three replacements record relatively high averages. This aligns with the idea of a more distributed approach to chance creation in the final third.
Notably, Ezzalzouli on his own produces a higher average shot creation score than both Wirtz and Paz. That comes with the important context that his contribution is shaped by his role as an attacker, but it further underlines how different profiles and positions can collectively replicate elite creative output.
The Rebuild
By integrating the analyzed profiles, we can reconstruct the output of a "departing star" through a diversified attack. This not only makes the team less reliant on a single individual but also makes the offensive structure harder for opponents to defend, as threats now emerge from multiple zones and varying action types. Below, we have created a projected line-up with our chosen profiles:
With Hugo Sotelo operating as the No. 6, we secure a stable distributor at the base of midfield. He underpins our progression through an elite volume of forward momentum actions in the Create phase, ranking in the 99th percentile. In addition, he averaged 4.55 pass attempts through the second last line (98th percentile) just in front of Granit Xhaka and Adam Wharton last season. Alongside Sotelo, we have selected Ilaix Moriba, also from Celta Vigo, to add a more aggressive edge in possession. Moriba is willing to take even greater risk with his pass attempts to runs ahead of the ball, and contributing across multiple phases as a dynamic No. 8 profile.
Completing the midfield is Kevin Danois, primarily chosen for his carrying ability but also because he features strongly in both our progression index and our ranking of shot-creating midfielders. Danois profiles somewhere between a No. 8 and a No. 10, with greater responsibility for joining attacks and combining with our isolated right winger, Gustav Isaksen.
On the right, Isaksen provides width and variation. He can carry inside to shoot himself, or create opportunities for others through passes and crosses. On the opposite flank, Abde Ezzalzouli offers a more balanced winger profile based on his shot-creation distribution (perhaps paired with a lapping fullback). The intention is for him to be a consistent goal threat alongside the centre forward while remaining unpredictable in his movement and decision making. He can engage fullbacks 1v1, step into the half space to combine, or crash the box when play develops on the opposite side.
Let’s now look at the total cost of acquiring these players based on their current market values:
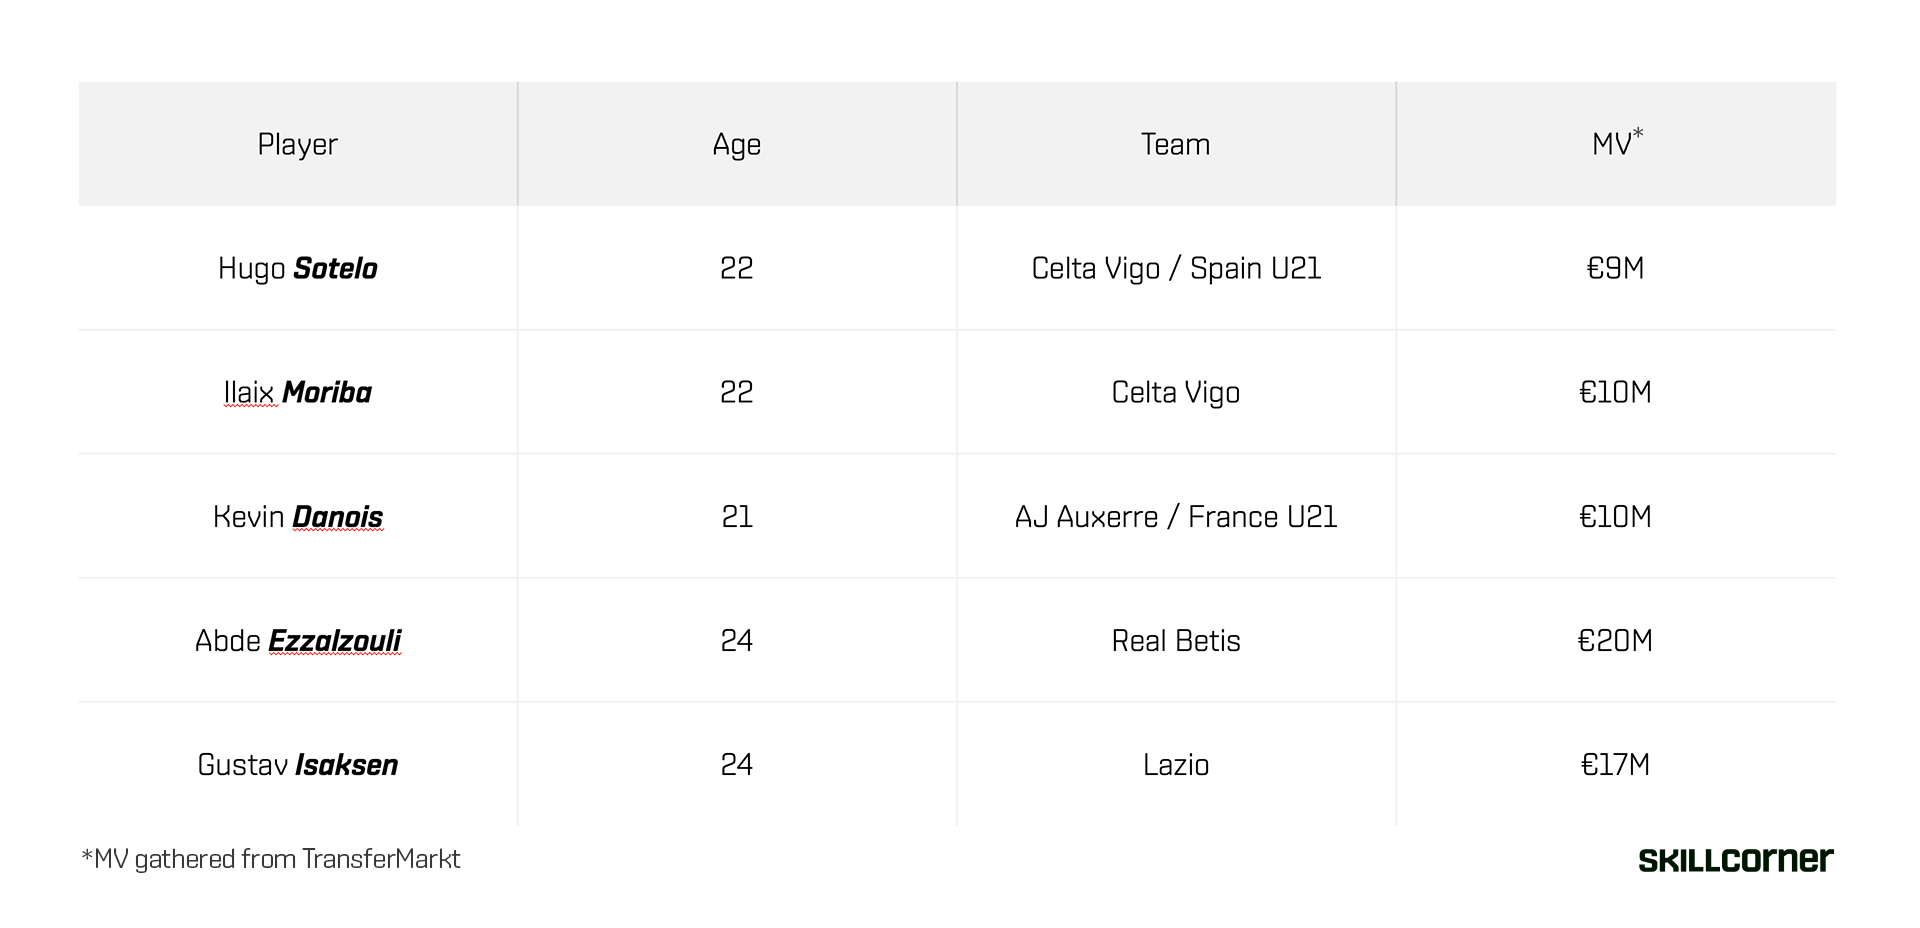
Although it would be unrealistic to sign all of these players, a combined market value of roughly €70 million illustrates how assembling a set of complementary profiles can collectively replace the influence of a departing “star” playmaker, while also spreading responsibility across the team and reducing risk in recruitment compared to pursuing a single like for like replacement. More interestingly, trying this scouting approach in lesser known markets could reveal undervalued players with the skills and characteristics you need in your team.
.jpg)
.png)
